
CPD Points Report
CPD Points Report
In this article:
- Overview
- How to run the report
- What the report shows
- Reporting by CPD category
- Exporting and saving
- Things to keep in mind
- FAQs
- Who can do this
Overview
The CPD Points Report totals up the Continuing Professional Development (CPD) points your people have earned over a period. You choose a Team, a CPD category and a time period, and SuperPath shows the total points earned, the average per person, a breakdown per category, and a row for each individual — so you can monitor CPD progress and compliance across your organisation.
How to run the report
- In the left-hand menu, open Reports.
- On the Reports page, click the CPD Points Report tile.
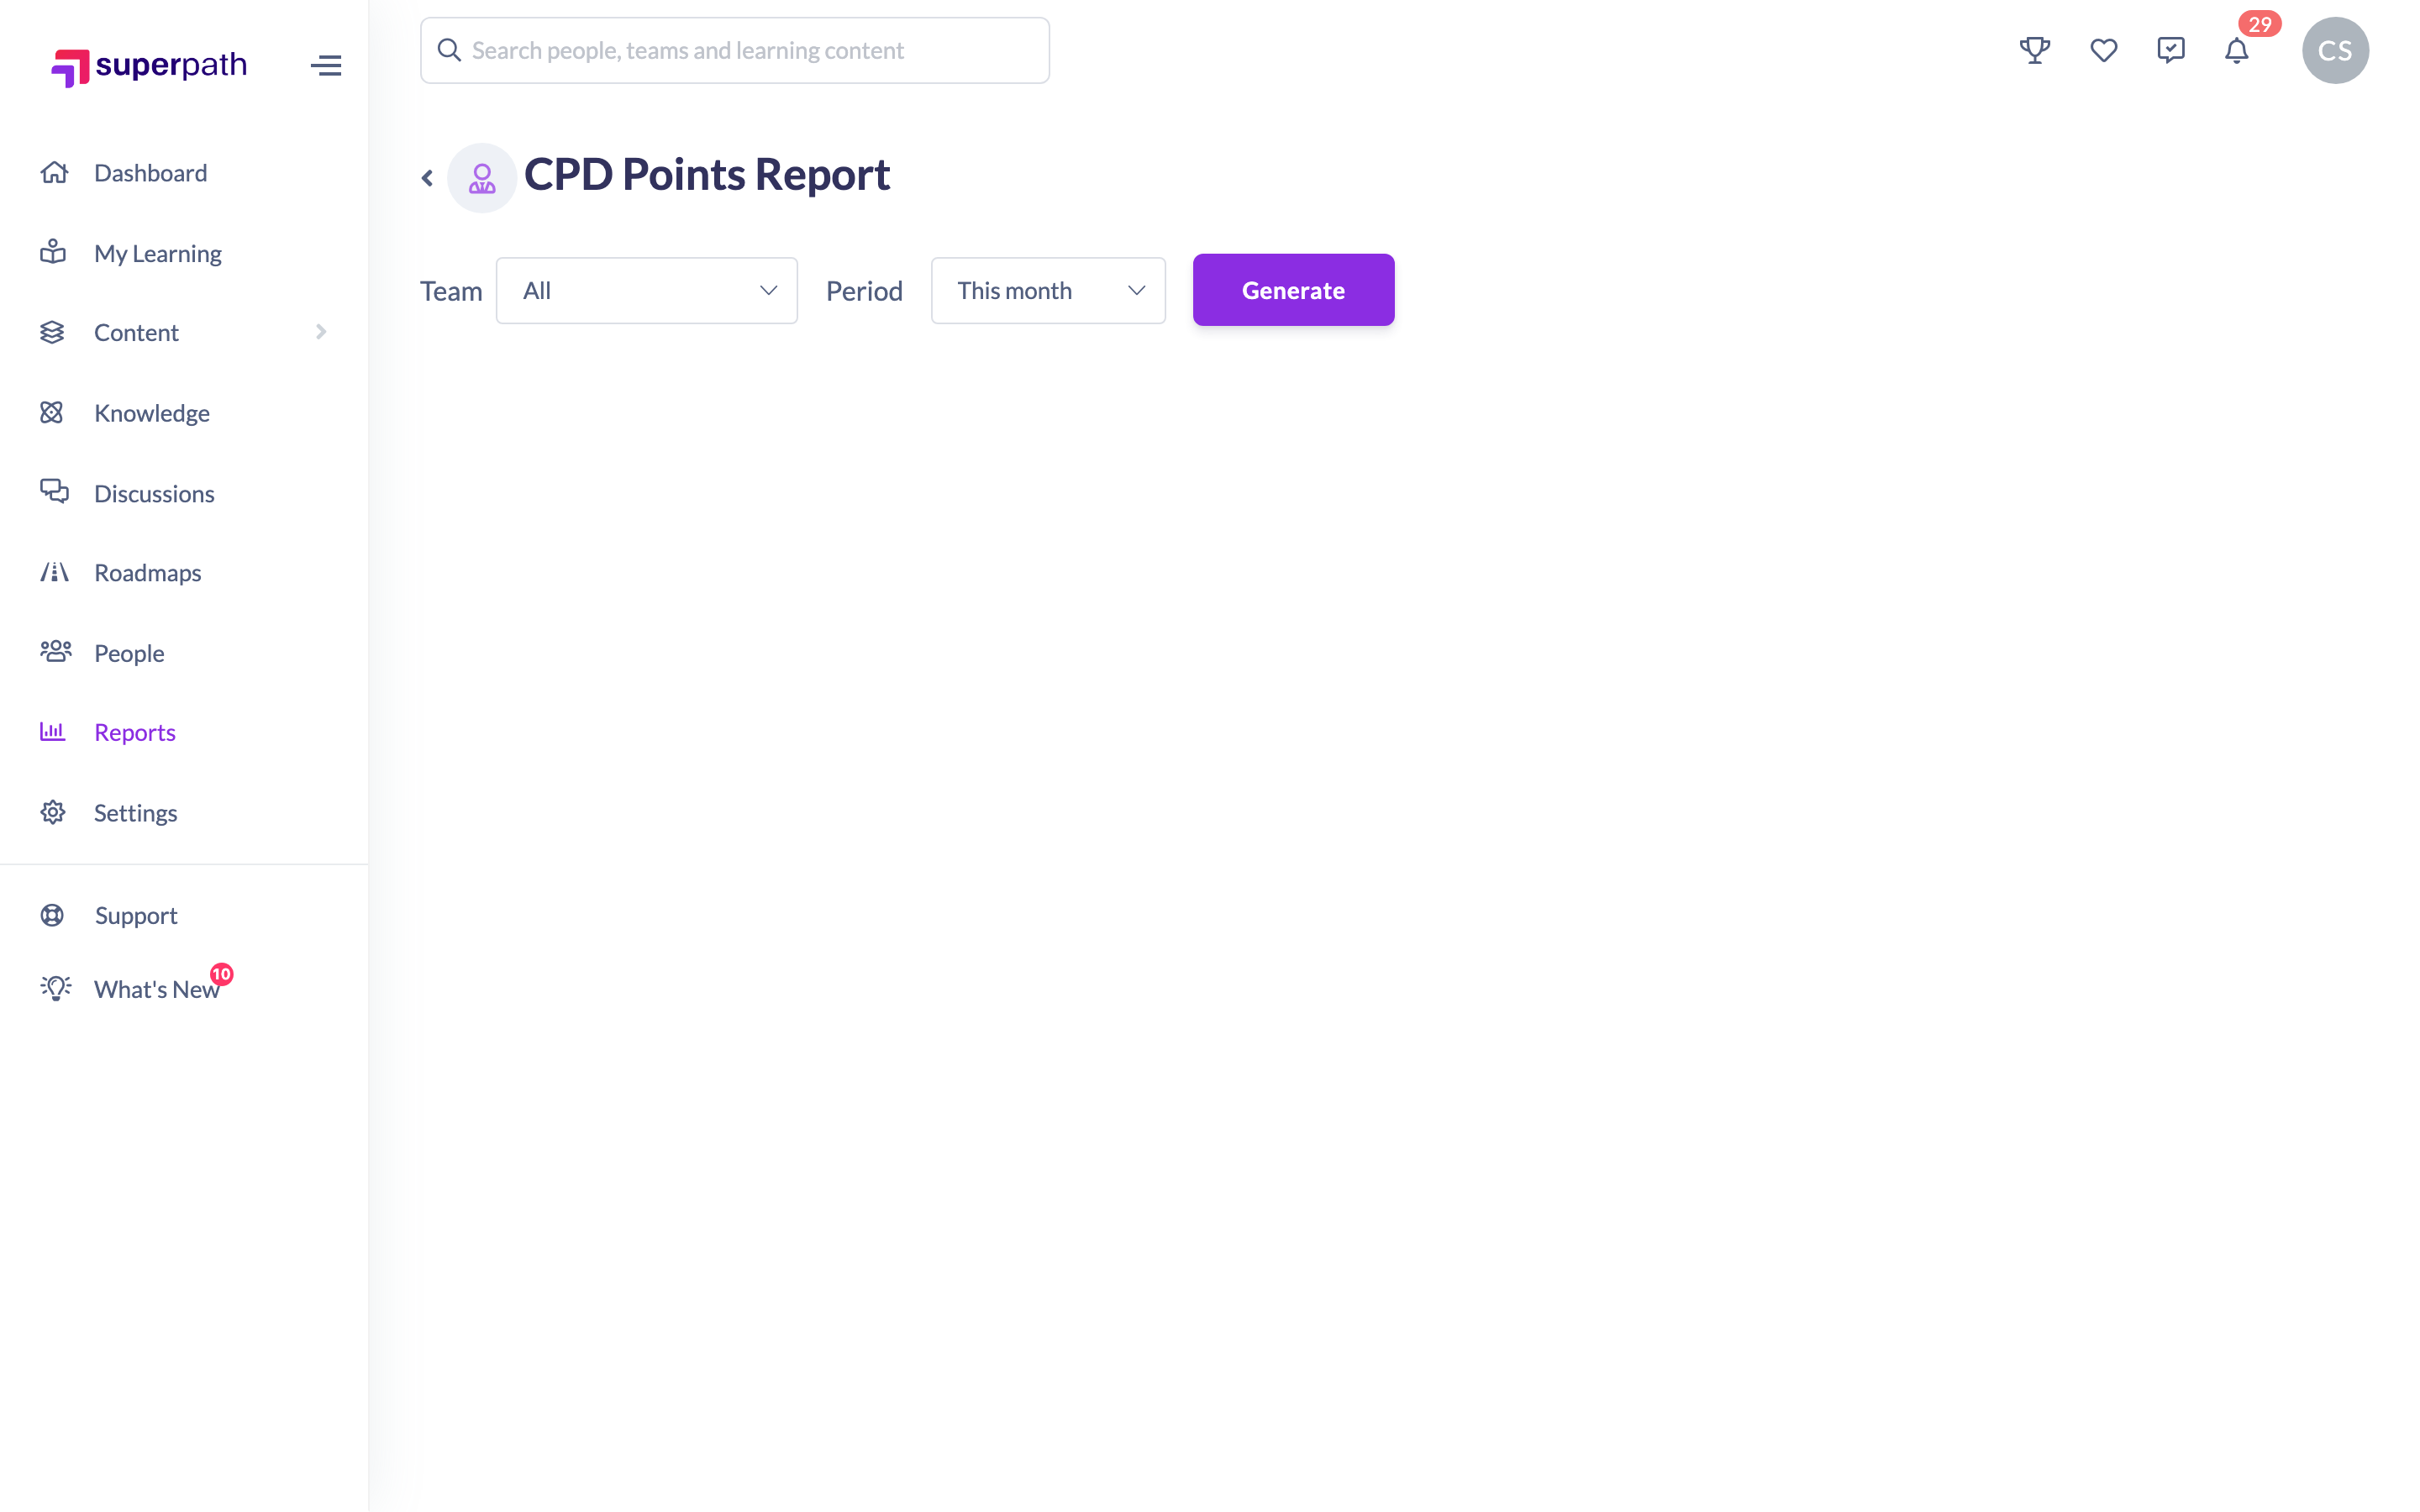
- Choose a Team — it defaults to All (the whole company).
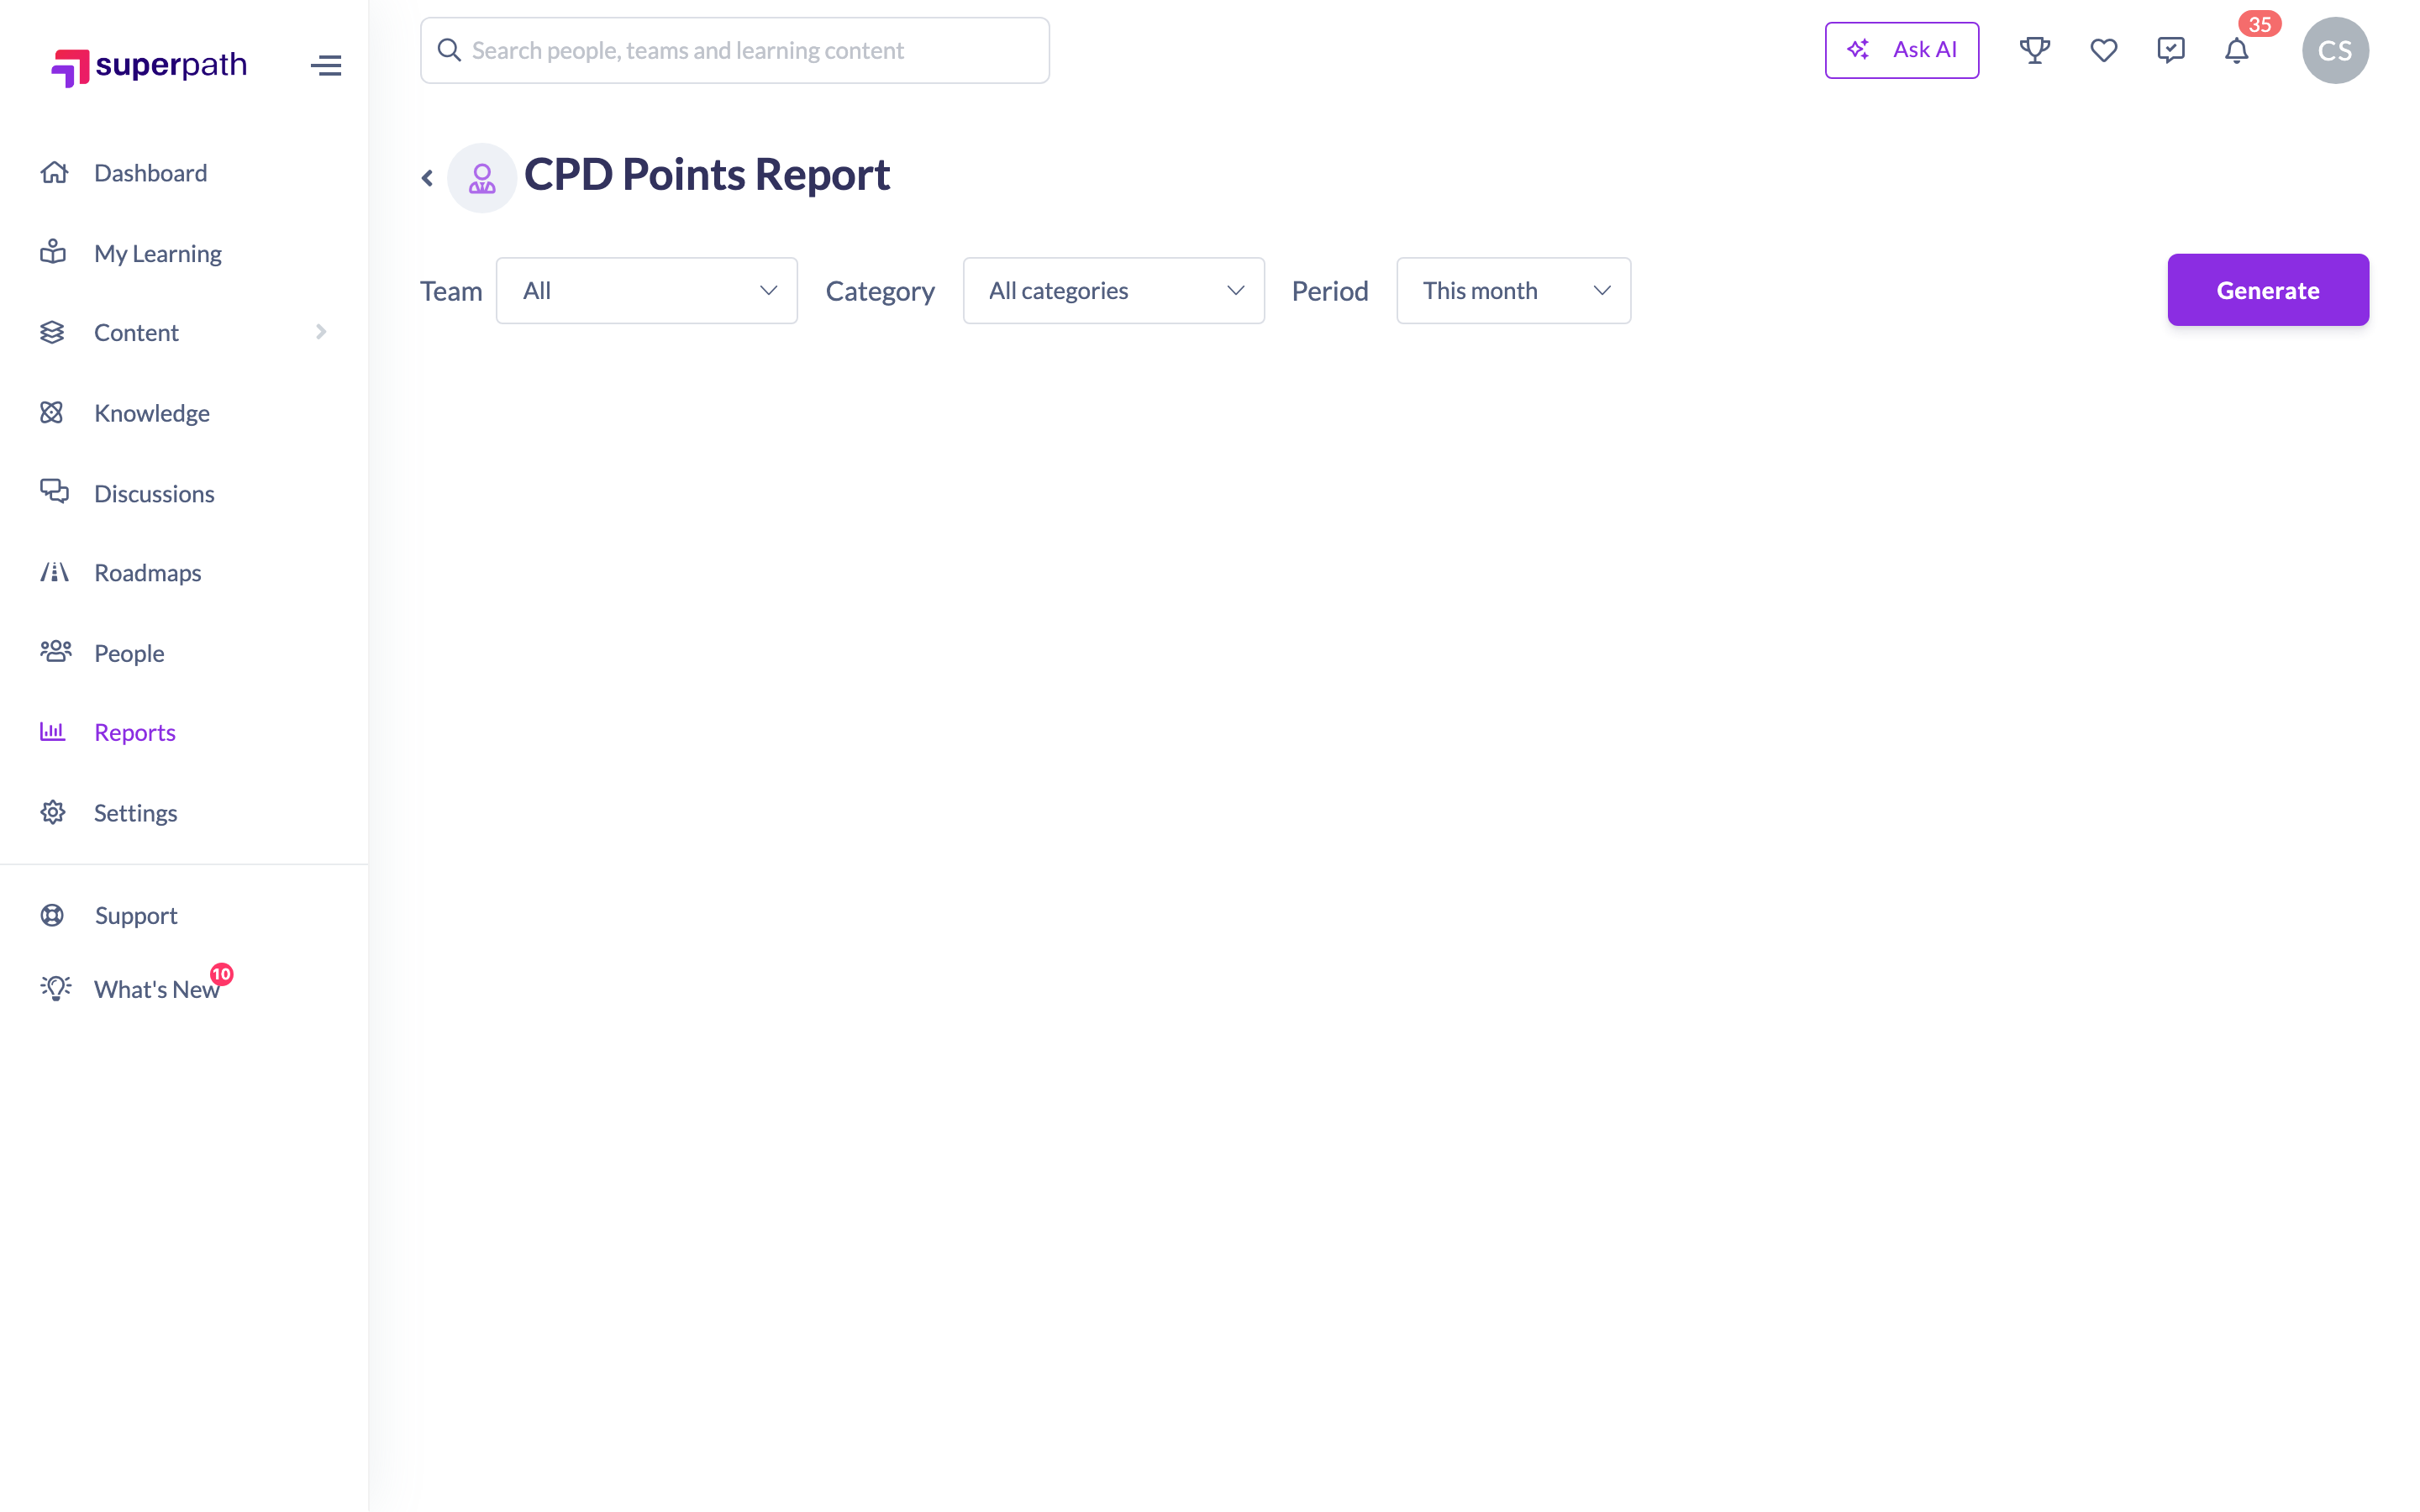
- Choose a Category — it defaults to All categories. You can also pick a single category, or No category for points recorded without one.
- Choose a Period — This month, Last month, This year, Last year, or Custom.
- If you chose Custom, pick your From and To dates.
- Click Generate.
What the report shows
Above the table, summary cards show the headline figures for the period:
- Total Points — the total CPD points earned across the selected people.
- Avg. Points — the average per person (total points divided by the number of learners).
Below the cards, a row of pills shows the points total for each category across everyone in the report — a quick read on how your organisation's CPD is distributed. Points recorded without a category appear as Uncategorised.
The table lists each person with their Name, Manager, Teams and Total Points for the period. If any Custom Fields have Include in reports turned on, each one is added as a column too, headed with the field's name.
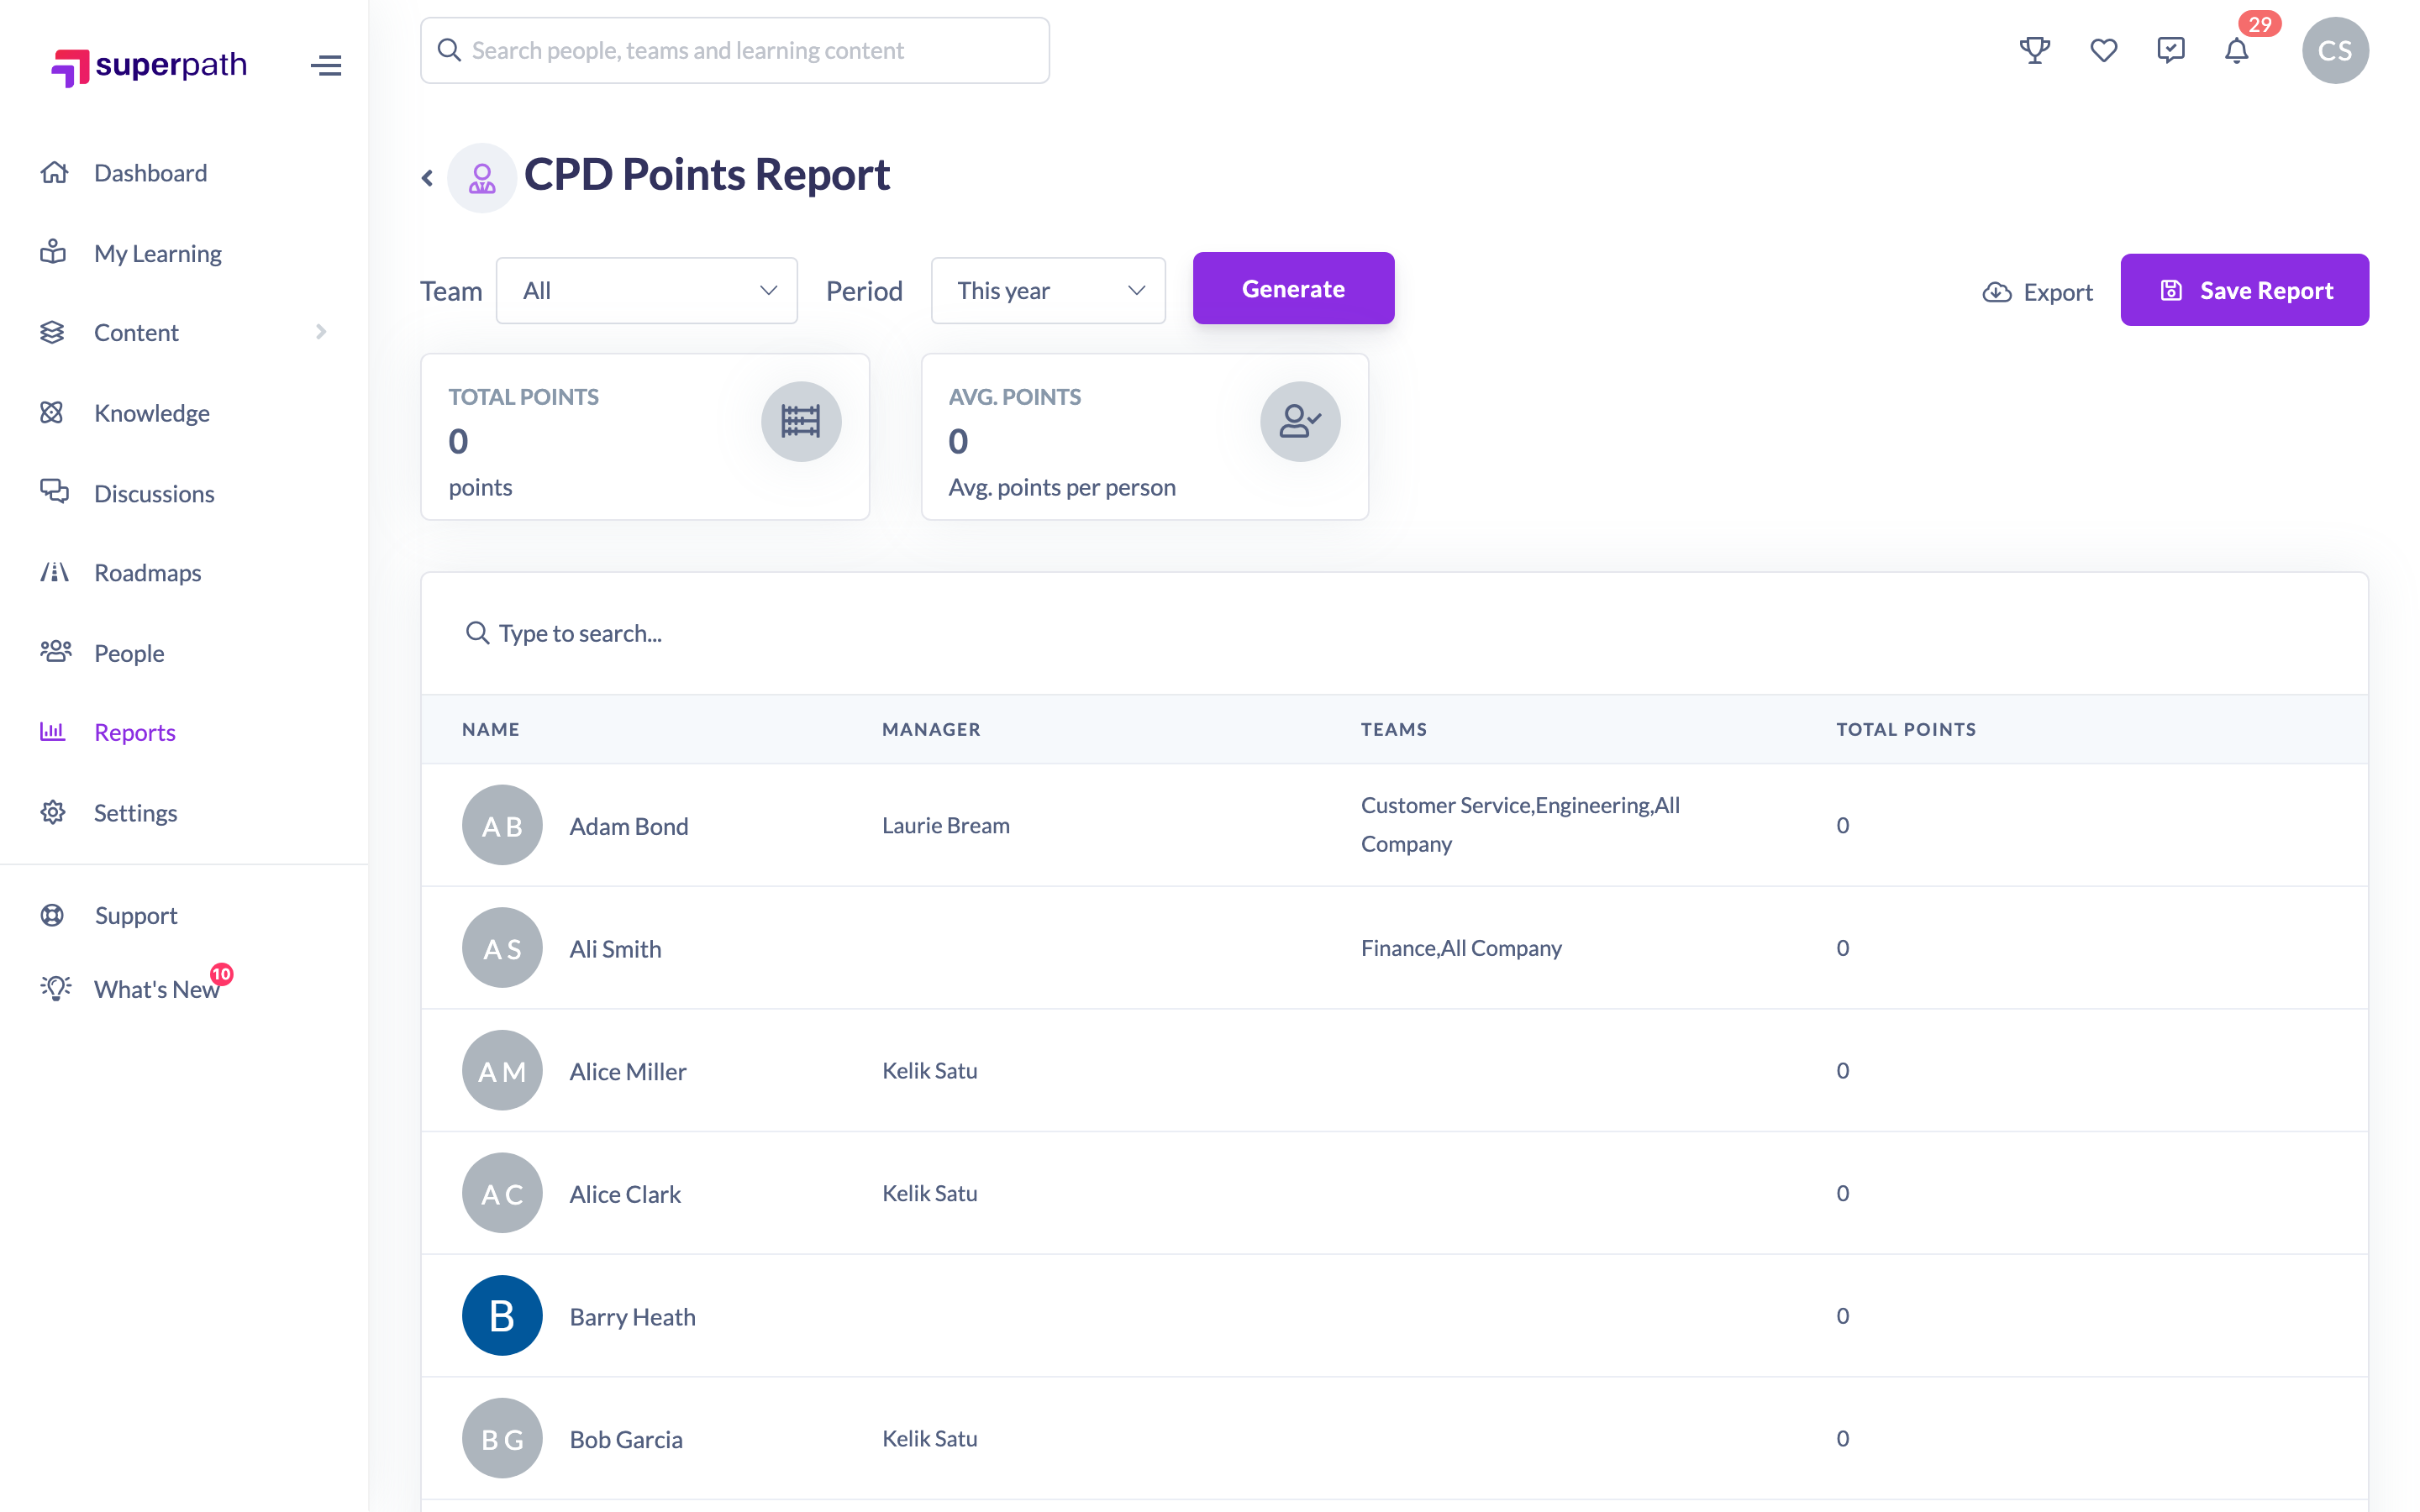
Use the search box above the table to filter by name, and sort by any column. If more than ten people are listed, use the Show dropdown and the pager at the bottom to page through them.
Reporting by CPD category
The Category filter changes what the report counts, and how much detail the table gives you:
- All categories (the default) — every point counts, and the table gains a column per category as well as Total Points. In one view you can see exactly how each person's points are distributed, which is usually what an accrediting body wants to see.
- A single category — only that category's points count. Total Points, Avg. Points and each person's total all reflect that category alone, and the per-category columns are hidden.
- No category — only points recorded without a category count. Useful for finding learning that still needs classifying.
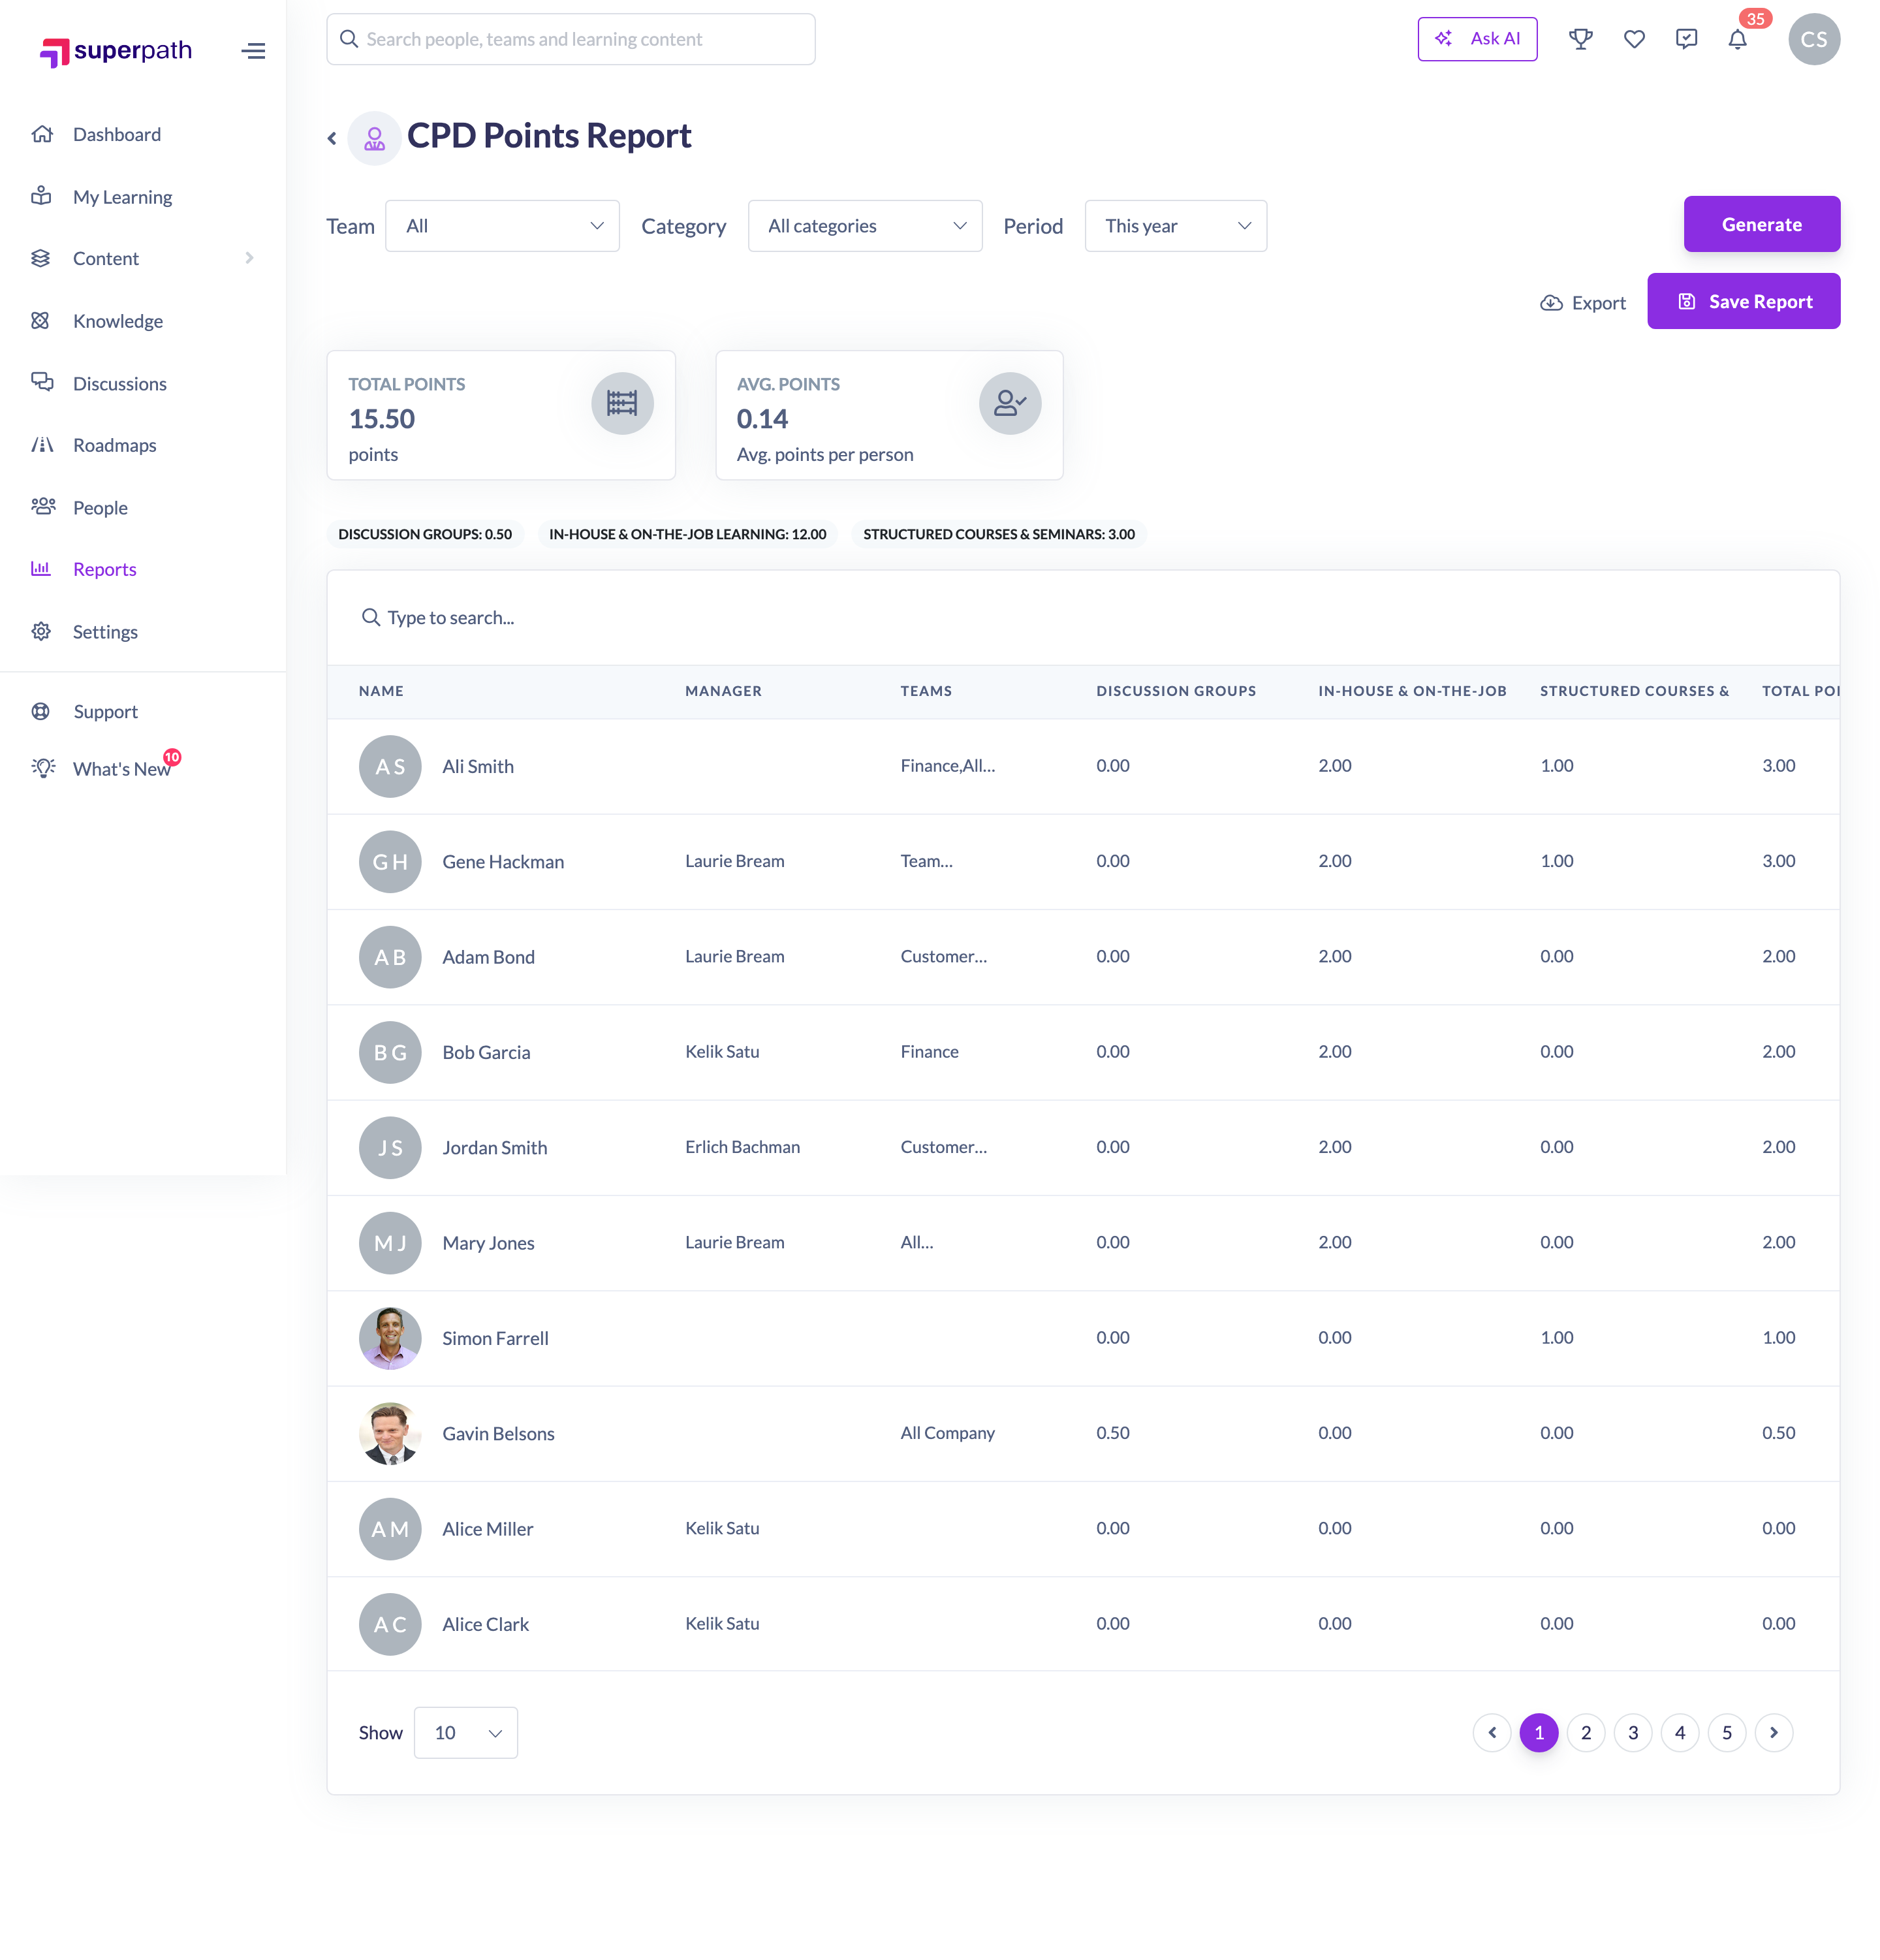
Changing the Category dropdown doesn't re-run the report on its own — click Generate again to apply it.
Categories come from the list an Owner or Admin curates in Settings → Features → CPD Categories; see How to Manage CPD Categories.
Exporting and saving
Once the report is generated you can:
- Export: click the Export button to choose which columns to include and download a CSV (see How to Export a Report to CSV and How to Choose Which Columns to Export). The export can include First Name, Last Name, Manager, Teams and Points, plus a column for each Custom Field included in reports. The CSV carries the Total Points for whatever category you generated the report with; it doesn't include the per-category columns.
- Save: click Save Report, give it a name you'll recognise in the Saved Reports tab, and click Save so you can reopen it later (see How to Save a Report). The Team, Category and Period you chose are all saved with it.
Things to keep in mind
- The report is available only when CPD Points are enabled for your platform.
- The figures cover only the period you select — change the Period to see a different range.
- Points are counted by the date the learning was completed, not the date the record was created. A back-dated manual CPD entry therefore lands in the period it actually belongs to.
- Manual CPD entries are counted alongside points earned in the platform. The report doesn't separate them — use a person's CPD tab to see which is which.
- Points earned before you started using categories, and points earned by completing a Learning or Event as a step inside a Pathway, are counted as Uncategorised.
- Per-category columns only appear when you generate with All categories selected.
- Managers and People Managers can only report on their own Teams; Owners and Admins can select any Team.
- Custom Field columns follow each field's access level. Owners and Admins see every field included in reports, while Managers and People Managers only see fields set to Everyone or Managers & admins (see Managing Custom Fields).
FAQs
How is the average calculated?
It's the total CPD points for the period divided by the number of learners included in the report.
Can I report on a custom date range?
Yes — choose Custom from the Period dropdown and set your From and To dates before generating.
How do I see each person's points broken down by category?
Generate the report with All categories selected. The table then includes a column for every category alongside Total Points.
What does Uncategorised mean?
Points that were recorded without a CPD category — usually learning completed before you set categories up, learning where no category was chosen, or a Learning or Event completed as a step inside a Pathway.
Does the CSV export include the category columns?
No. The export covers First Name, Last Name, Manager, Teams, Points and any Custom Fields included in reports, with Points reflecting the category you generated the report with.
Are manually added CPD points included?
Yes. Manual entries count towards the totals and the per-category breakdown just like points earned from completed learning.
Why can't I see this report?
The CPD Points Report only appears when CPD Points are enabled for your platform. If you don't see the tile on the Reports page, CPD isn't enabled.
Who can do this
The CPD Points Report is reached from the Reports page, which is available to Owners, Admins, Managers and People Managers; the report tile also requires CPD Points to be enabled for your platform. Managers and People Managers can only report on their own Teams, while Owners and Admins can select any Team. Every role that can open the report can use the Category filter. Content Managers, Instructors, Employees and Restricted users don't have access to the Reports area.
Updated on: 29/09/2026
Thank you!