
Learning Time Report
Learning Time Report
In this article:
- Overview
- Running the report
- Reading the results
- Exporting and saving
- Things to keep in mind
- FAQs
- Who can do this
Overview
The Learning Time Report shows how much time your learners have spent learning over a period, alongside how many learnings that time relates to. Use it to gauge learning effort across your whole organisation or a single Team, and to compare totals against per-person averages.
Running the report
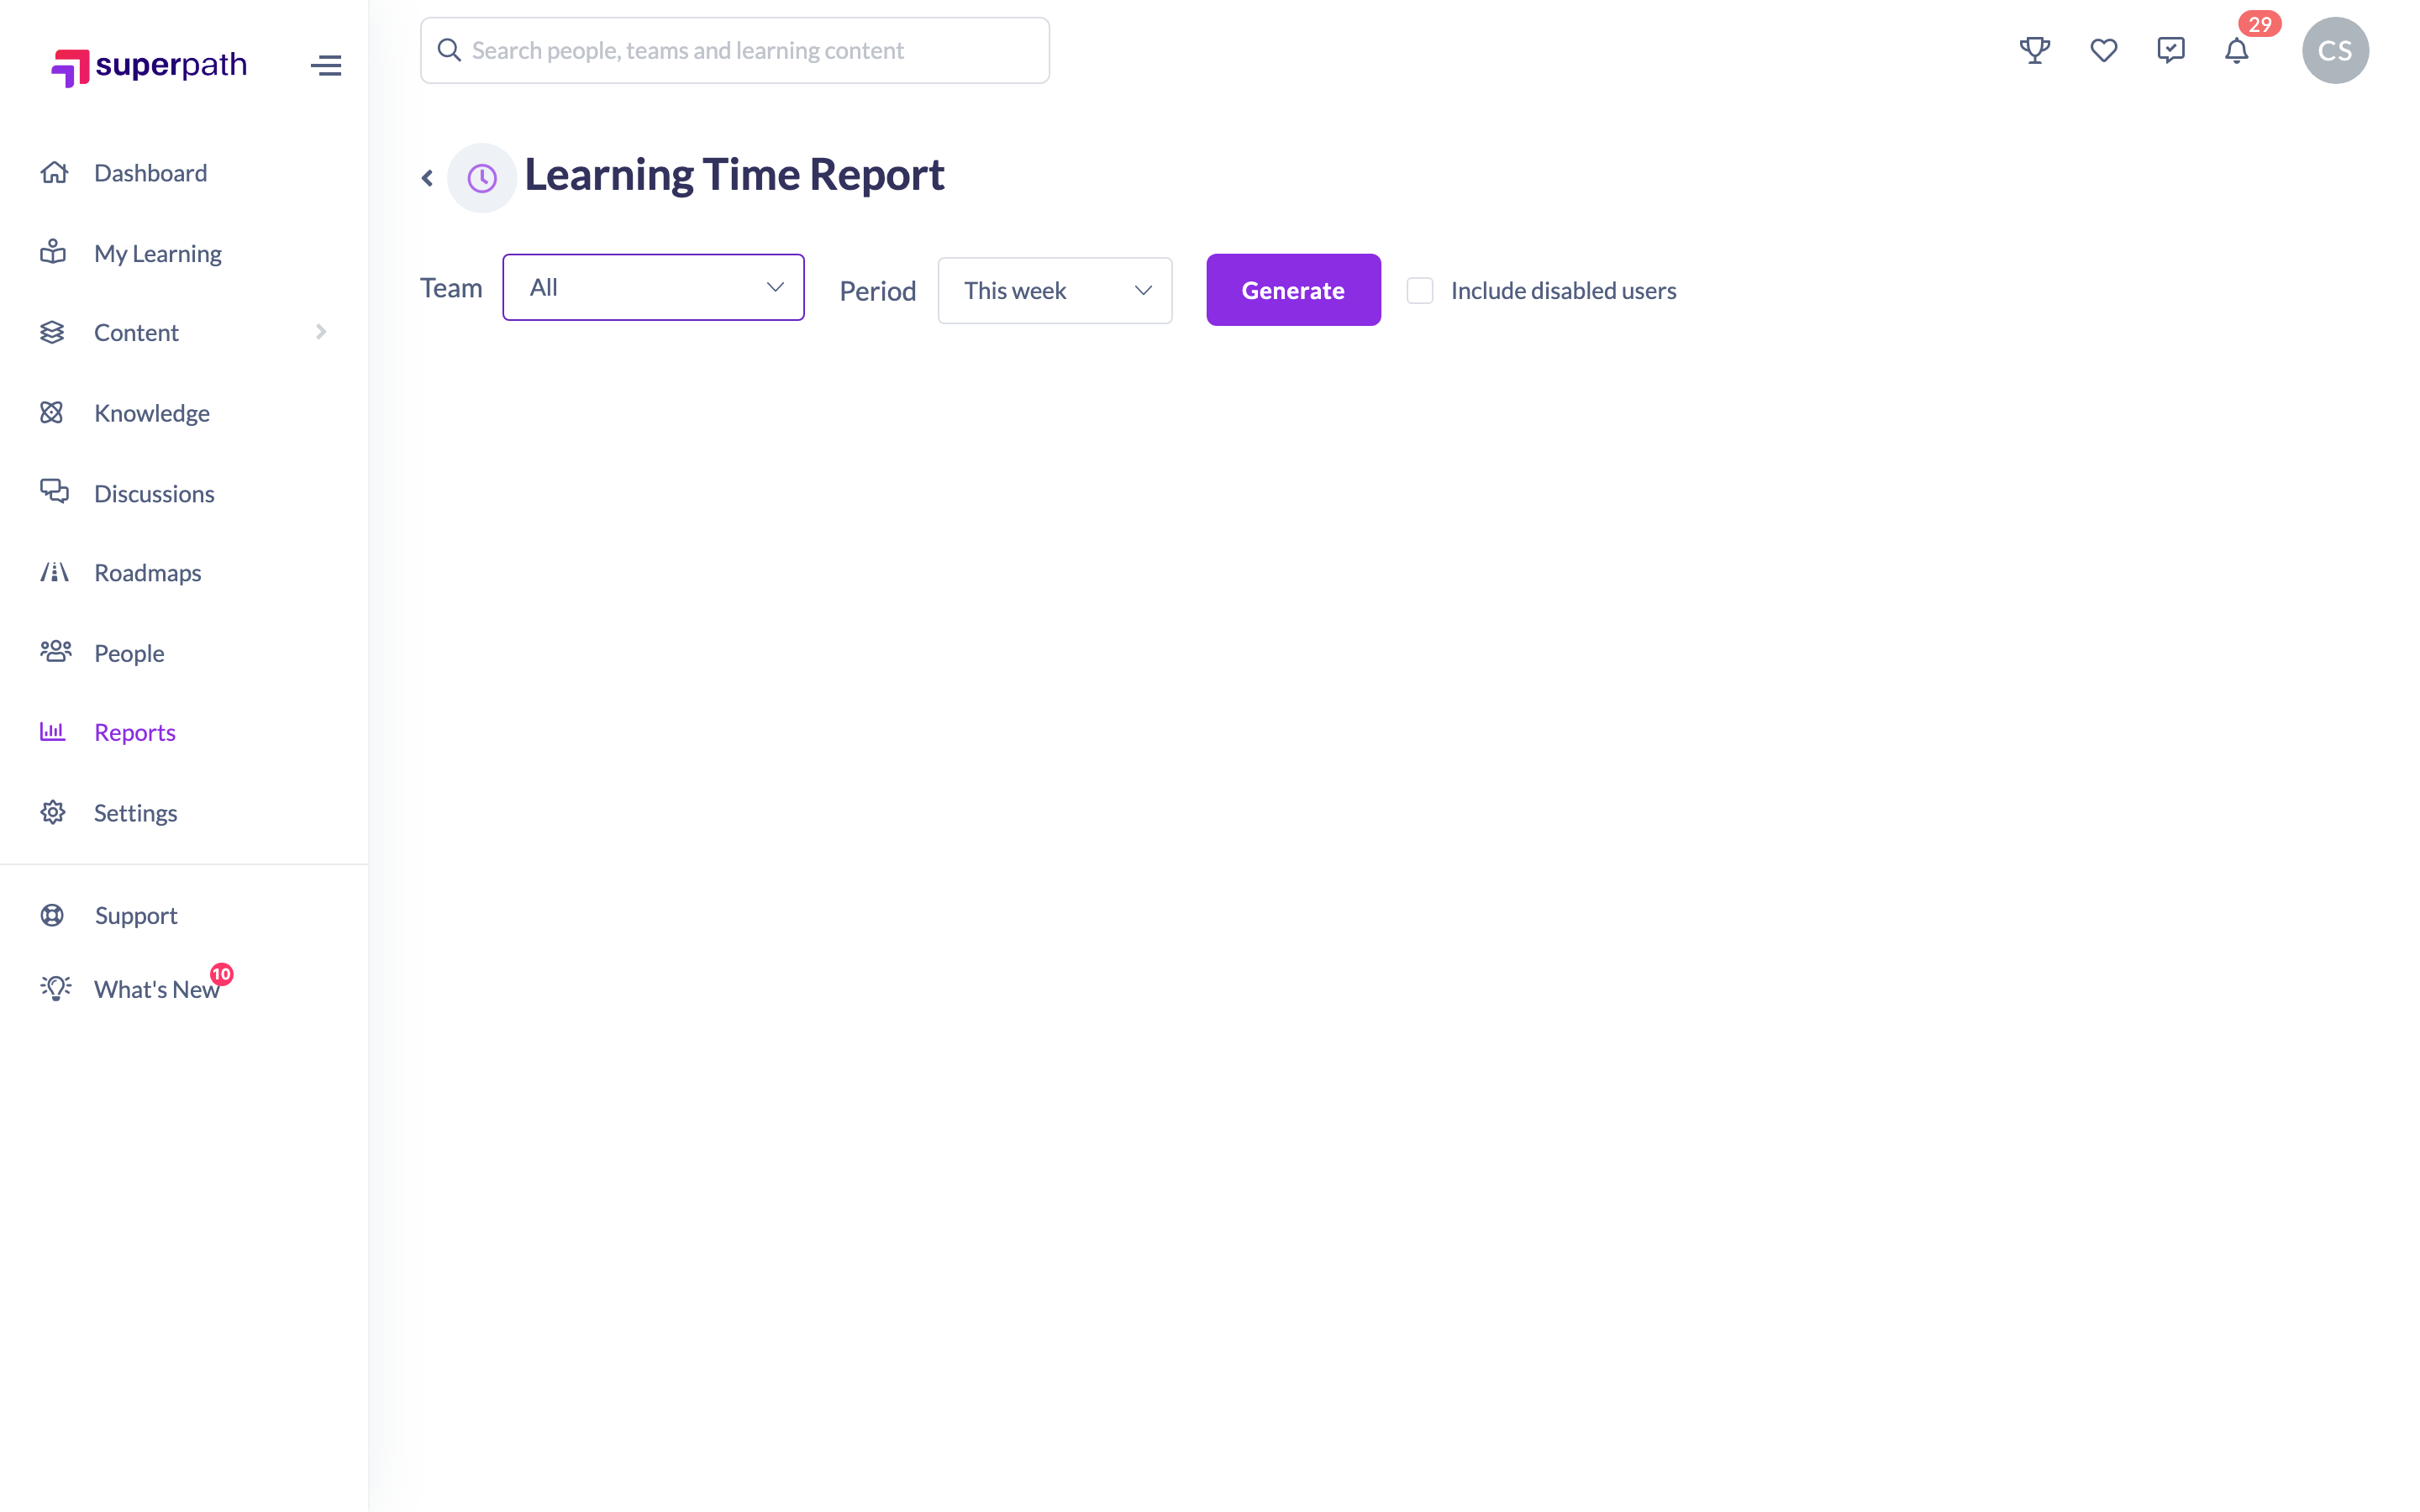
- Go to Reports in the left-hand menu (the New Reports tab).
- Click the Learning Time Report card.
- Use the Team dropdown to choose who to report on — leave it on All for the whole organisation, or pick a Team.
- Use the Period dropdown to choose a time range: This Week, Last Week, This Month, Last Month or Custom. Choosing Custom reveals From and To date pickers.
- Tick Include disabled users if you want deactivated people counted too.
- Click Generate.
Reading the results
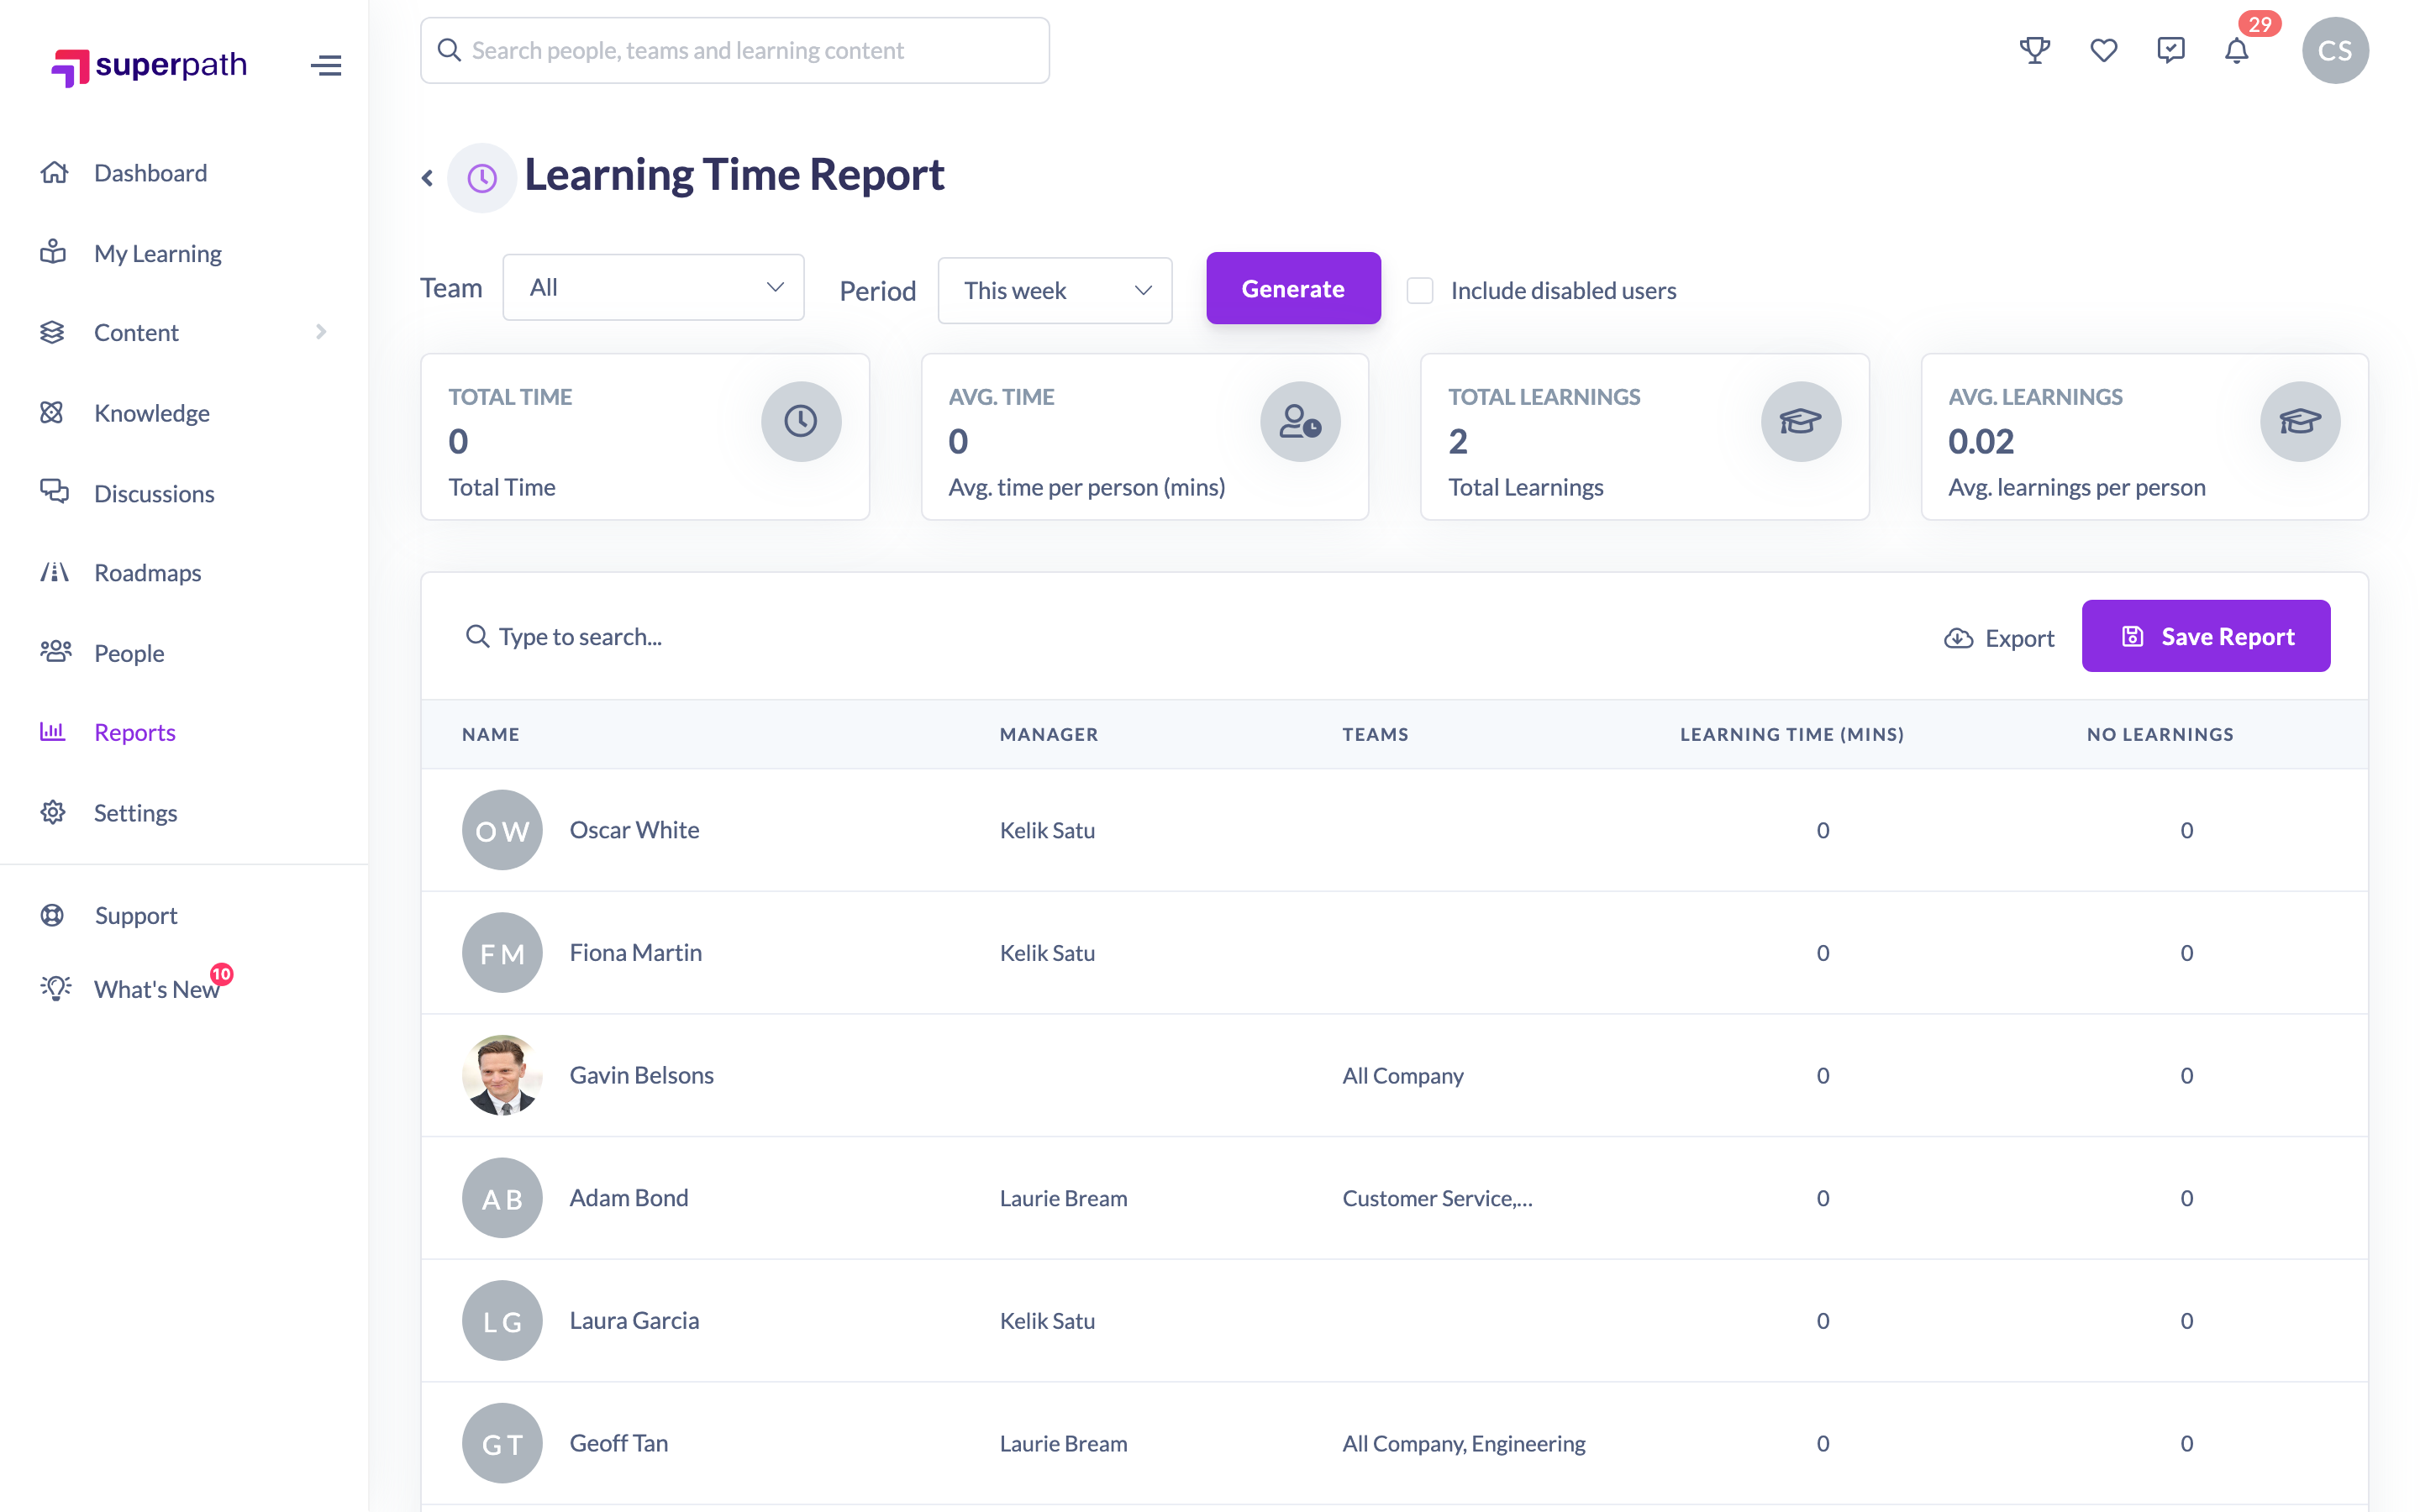
Once generated, the report shows four summary cards above a per-learner table:
- Total Time — all learning time across the selected people and period.
- Average Time — the total time divided by the number of learners (per person, in minutes).
- Total Learnings — the number of learnings that time relates to for the period.
- Average Learnings — total learnings divided by the number of learners.
The table below lists each learner with their time and learnings, and can be sorted and searched.
Exporting and saving
- Click Export to download the data as a CSV. You'll first choose which columns to include, then the file is saved to your Downloads folder (see How to Choose Which Columns to Export).
- Click Save Report to store the report's settings so you can run it again later. Give it a name you'll recognise on the Saved Reports tab, then click Save. Saved reports open from the Saved Reports tab on the Reports page.

Things to keep in mind
- Time is counted only for the period and Team you select — widen the Period or switch the Team to All if a figure looks low.
- A saved report stores its filters, not a snapshot: re-opening it re-runs against live data, so figures update over time.
- Include disabled users is off by default, so deactivated people are excluded unless you tick it.
FAQs
Can I report on a single Team?
Yes. Choose the Team from the Team dropdown before clicking Generate. Leave it on All for the whole organisation.
Is average time shown per person?
Yes. Average Time is the total time divided by the number of learners, and Average Learnings works the same way.
Where do saved reports live?
On the Saved Reports tab of the Reports page. Open one to run it again at any time.
Who can do this
Owners, Admins, Managers and People Managers can reach the Reports area and run the Learning Time Report. Content Managers, Instructors, Employees and Restricted users do not have access to the Reports area.
Updated on: 24/07/2026
Thank you!