
How to Open a Quick Report for a Learning Item
How to Open a Quick Report for a Learning Item
In this article:
- Overview
- How to open a quick report
- What the quick report shows
- Table view vs analytics view
- Exporting the learner report
- Actions you can take from a quick report
- Things to keep in mind
- FAQs
- Who can do this
Overview
A quick report is a fast, in-context view of who has been assigned a single learning item and how they are progressing — without setting up a full report. You open it straight from the item itself (a Library content item, a Pathway, an Event, a Form or a Roadmap), and it slides open as a panel on the right of the screen. From there you can filter and search the learner list, switch to a charts view, export the data, and take admin actions such as changing due dates or marking learners complete.
How to open a quick report
- Go to the area that holds the item — Pathways, Events, Forms & Quizzes or Roadmaps for those items, or Settings → Library (Manage Private Library) for content.
- Find the item you want in the list (use the search box if you have many).
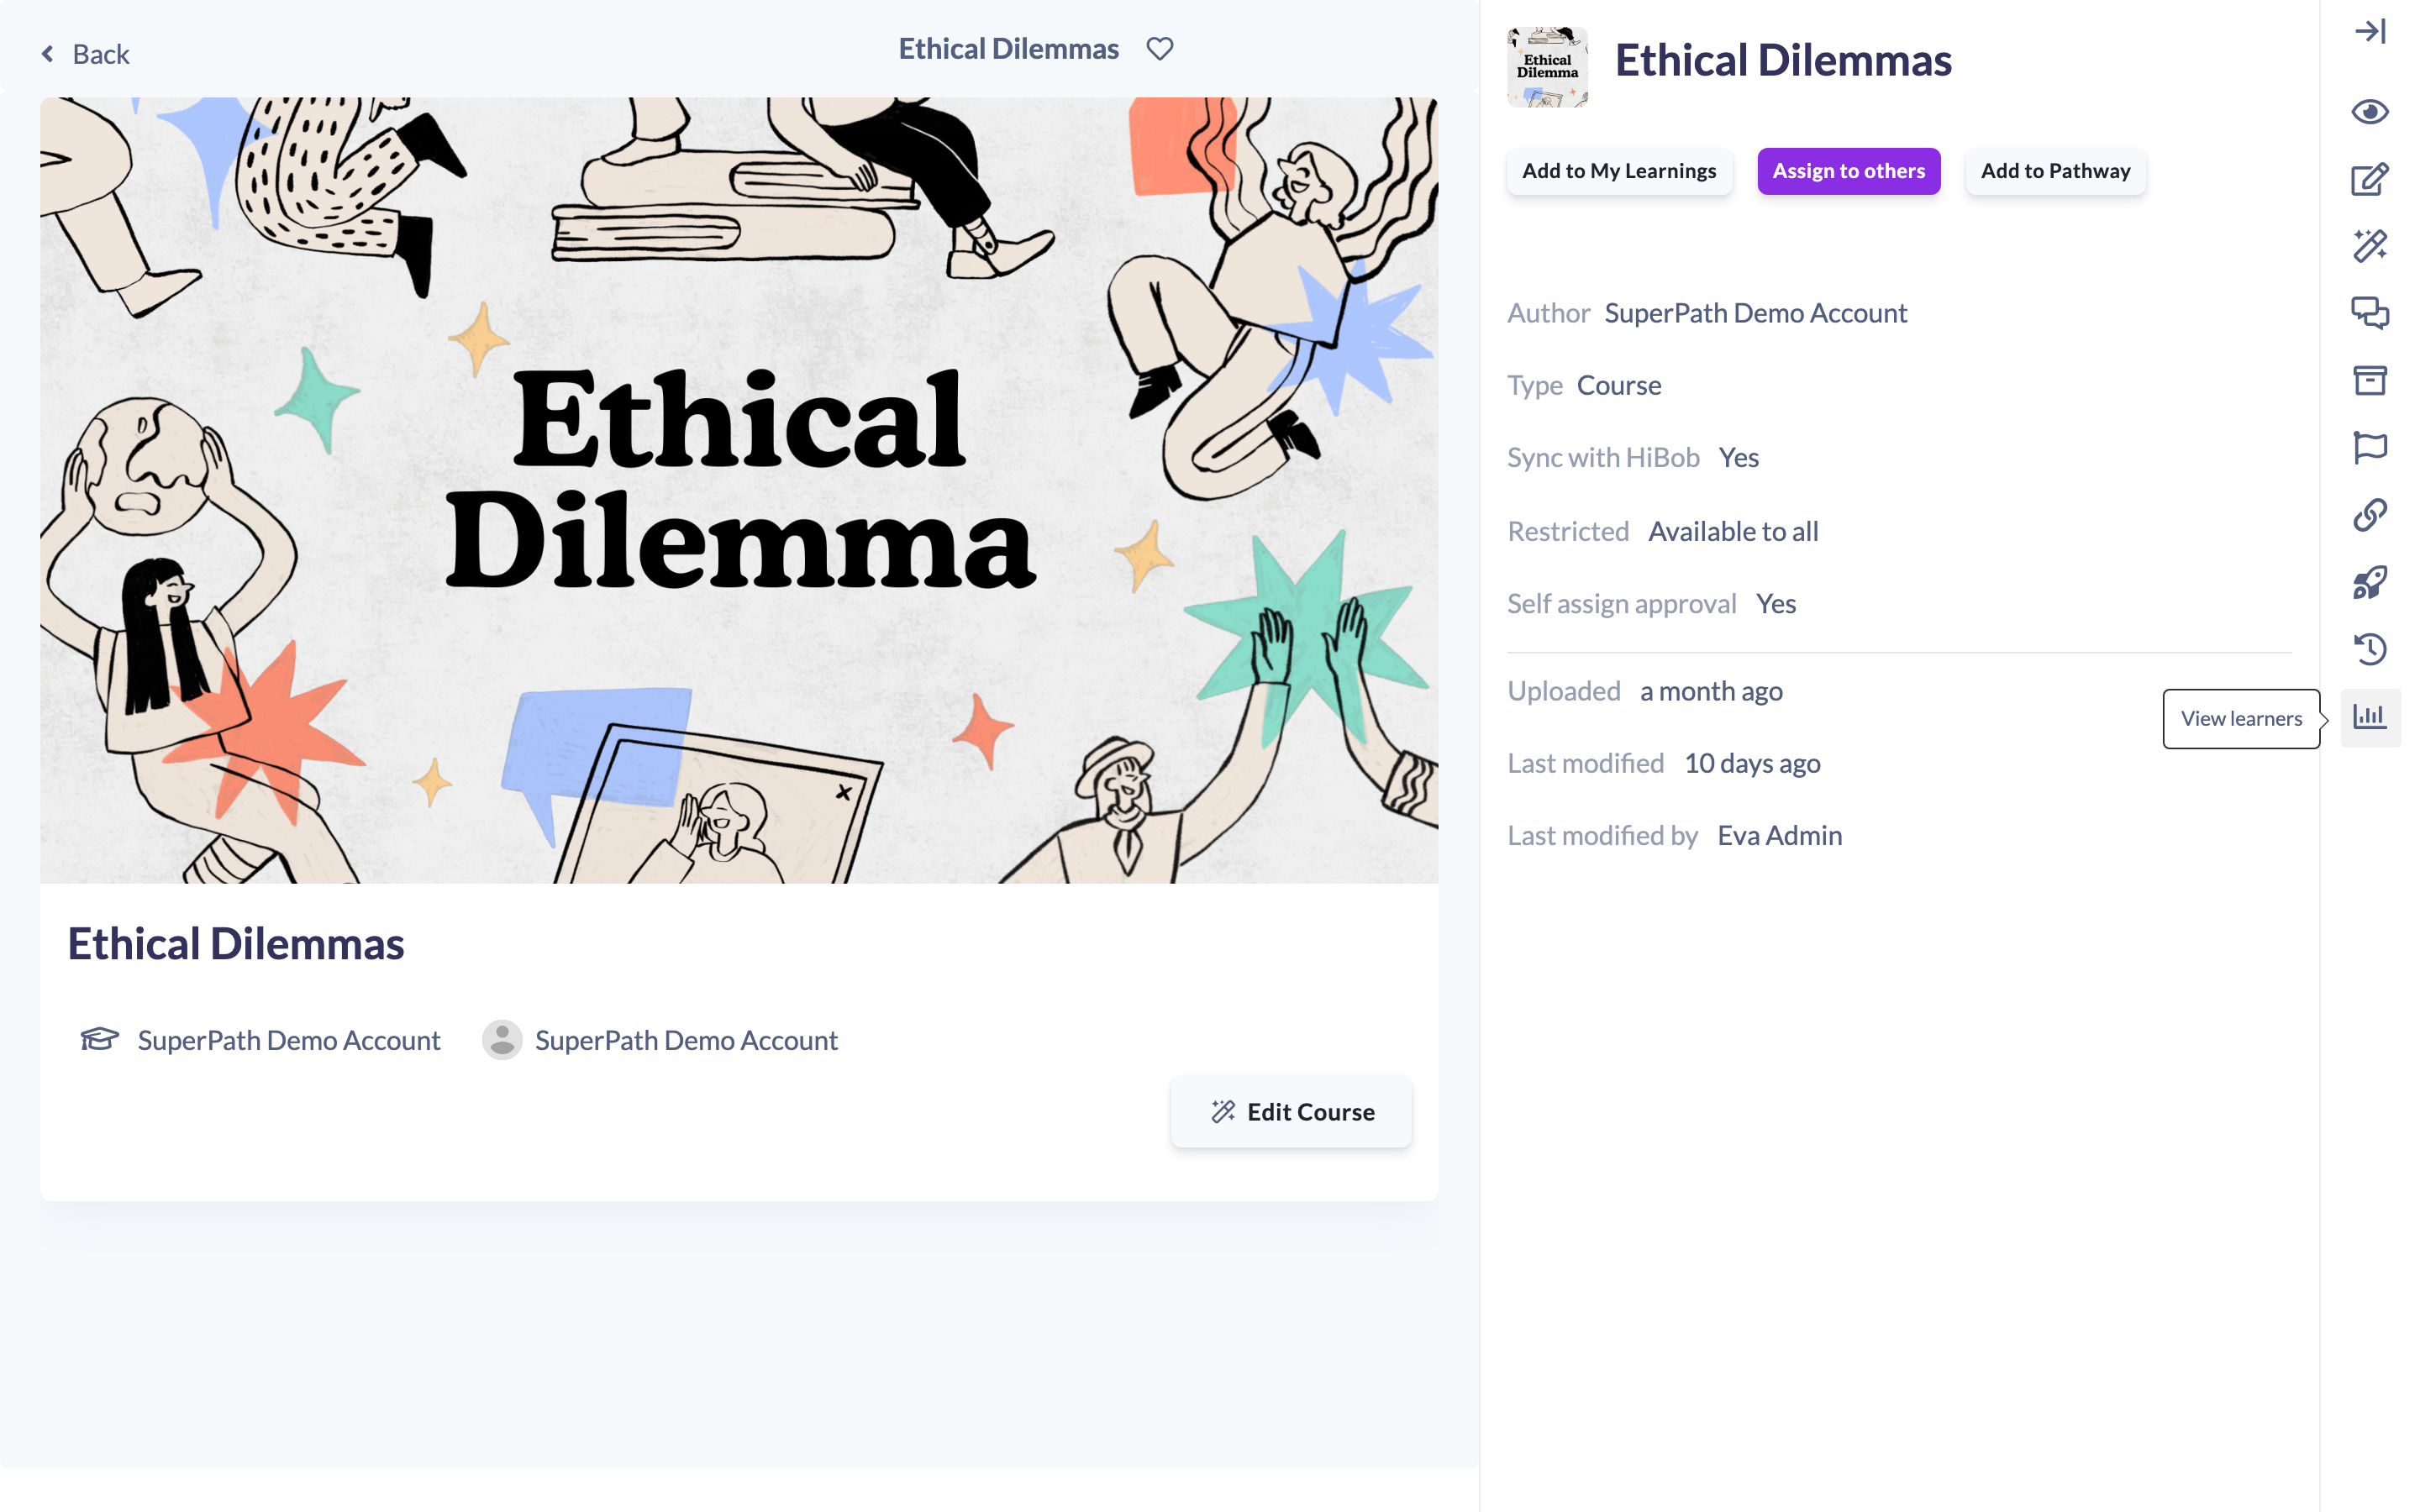
- In the item's row, click the View learners icon (the bar-chart icon in the row actions).
- SuperPath opens the quick-report panel on the right for that item.
Tip: For a Library content item you can also open the quick report from the content item's own detail page (open the item from the Library, then click View learners in the right-hand toolbar) — you don't need to go through Settings.
What the quick report shows
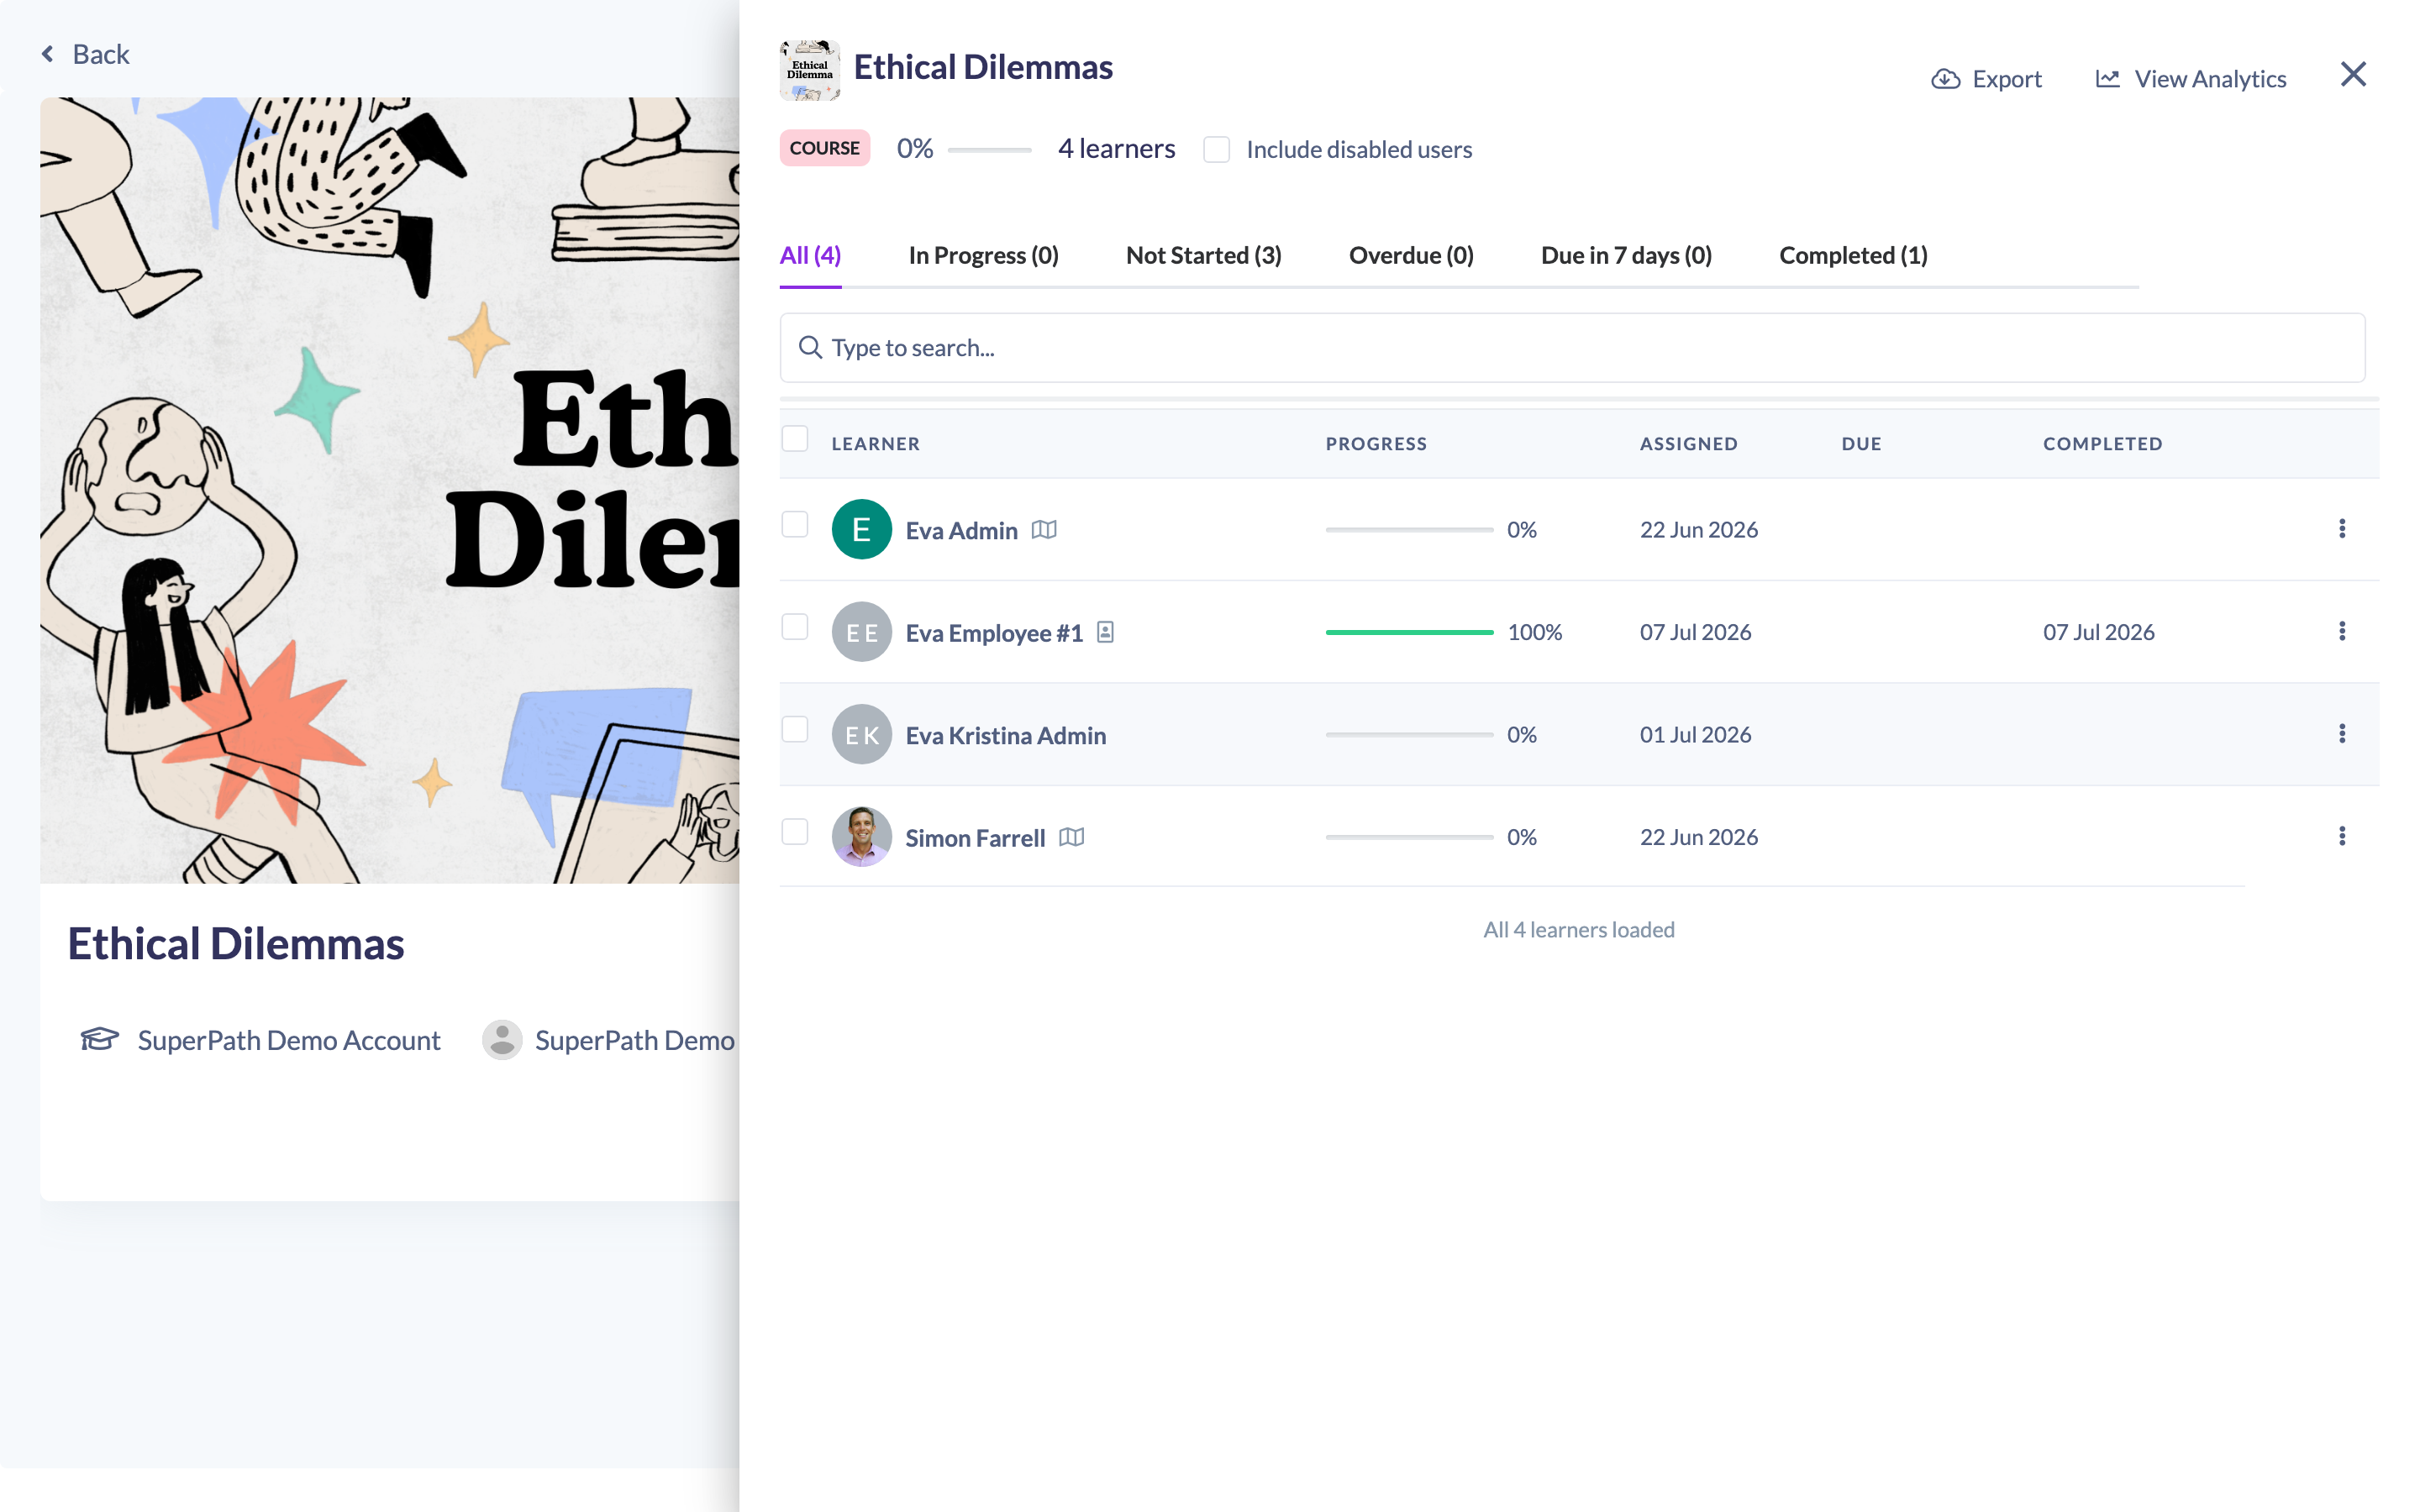
At the top of the panel you'll see the item's title, a type badge, the average progress across learners, the number of learners, and an Include disabled users checkbox.
Below that is a table of every learner attached to the item, with their status, progress, due date and assignment details. You can:
- Filter by status using the tabs — All, In progress, Not started, Overdue, Due in 7 days and Completed — each showing a count.
- Search the list by name or status.
- Sort by clicking a column header.
- Tick Include disabled users to bring disabled learners into the list and counts.
Table view vs analytics view
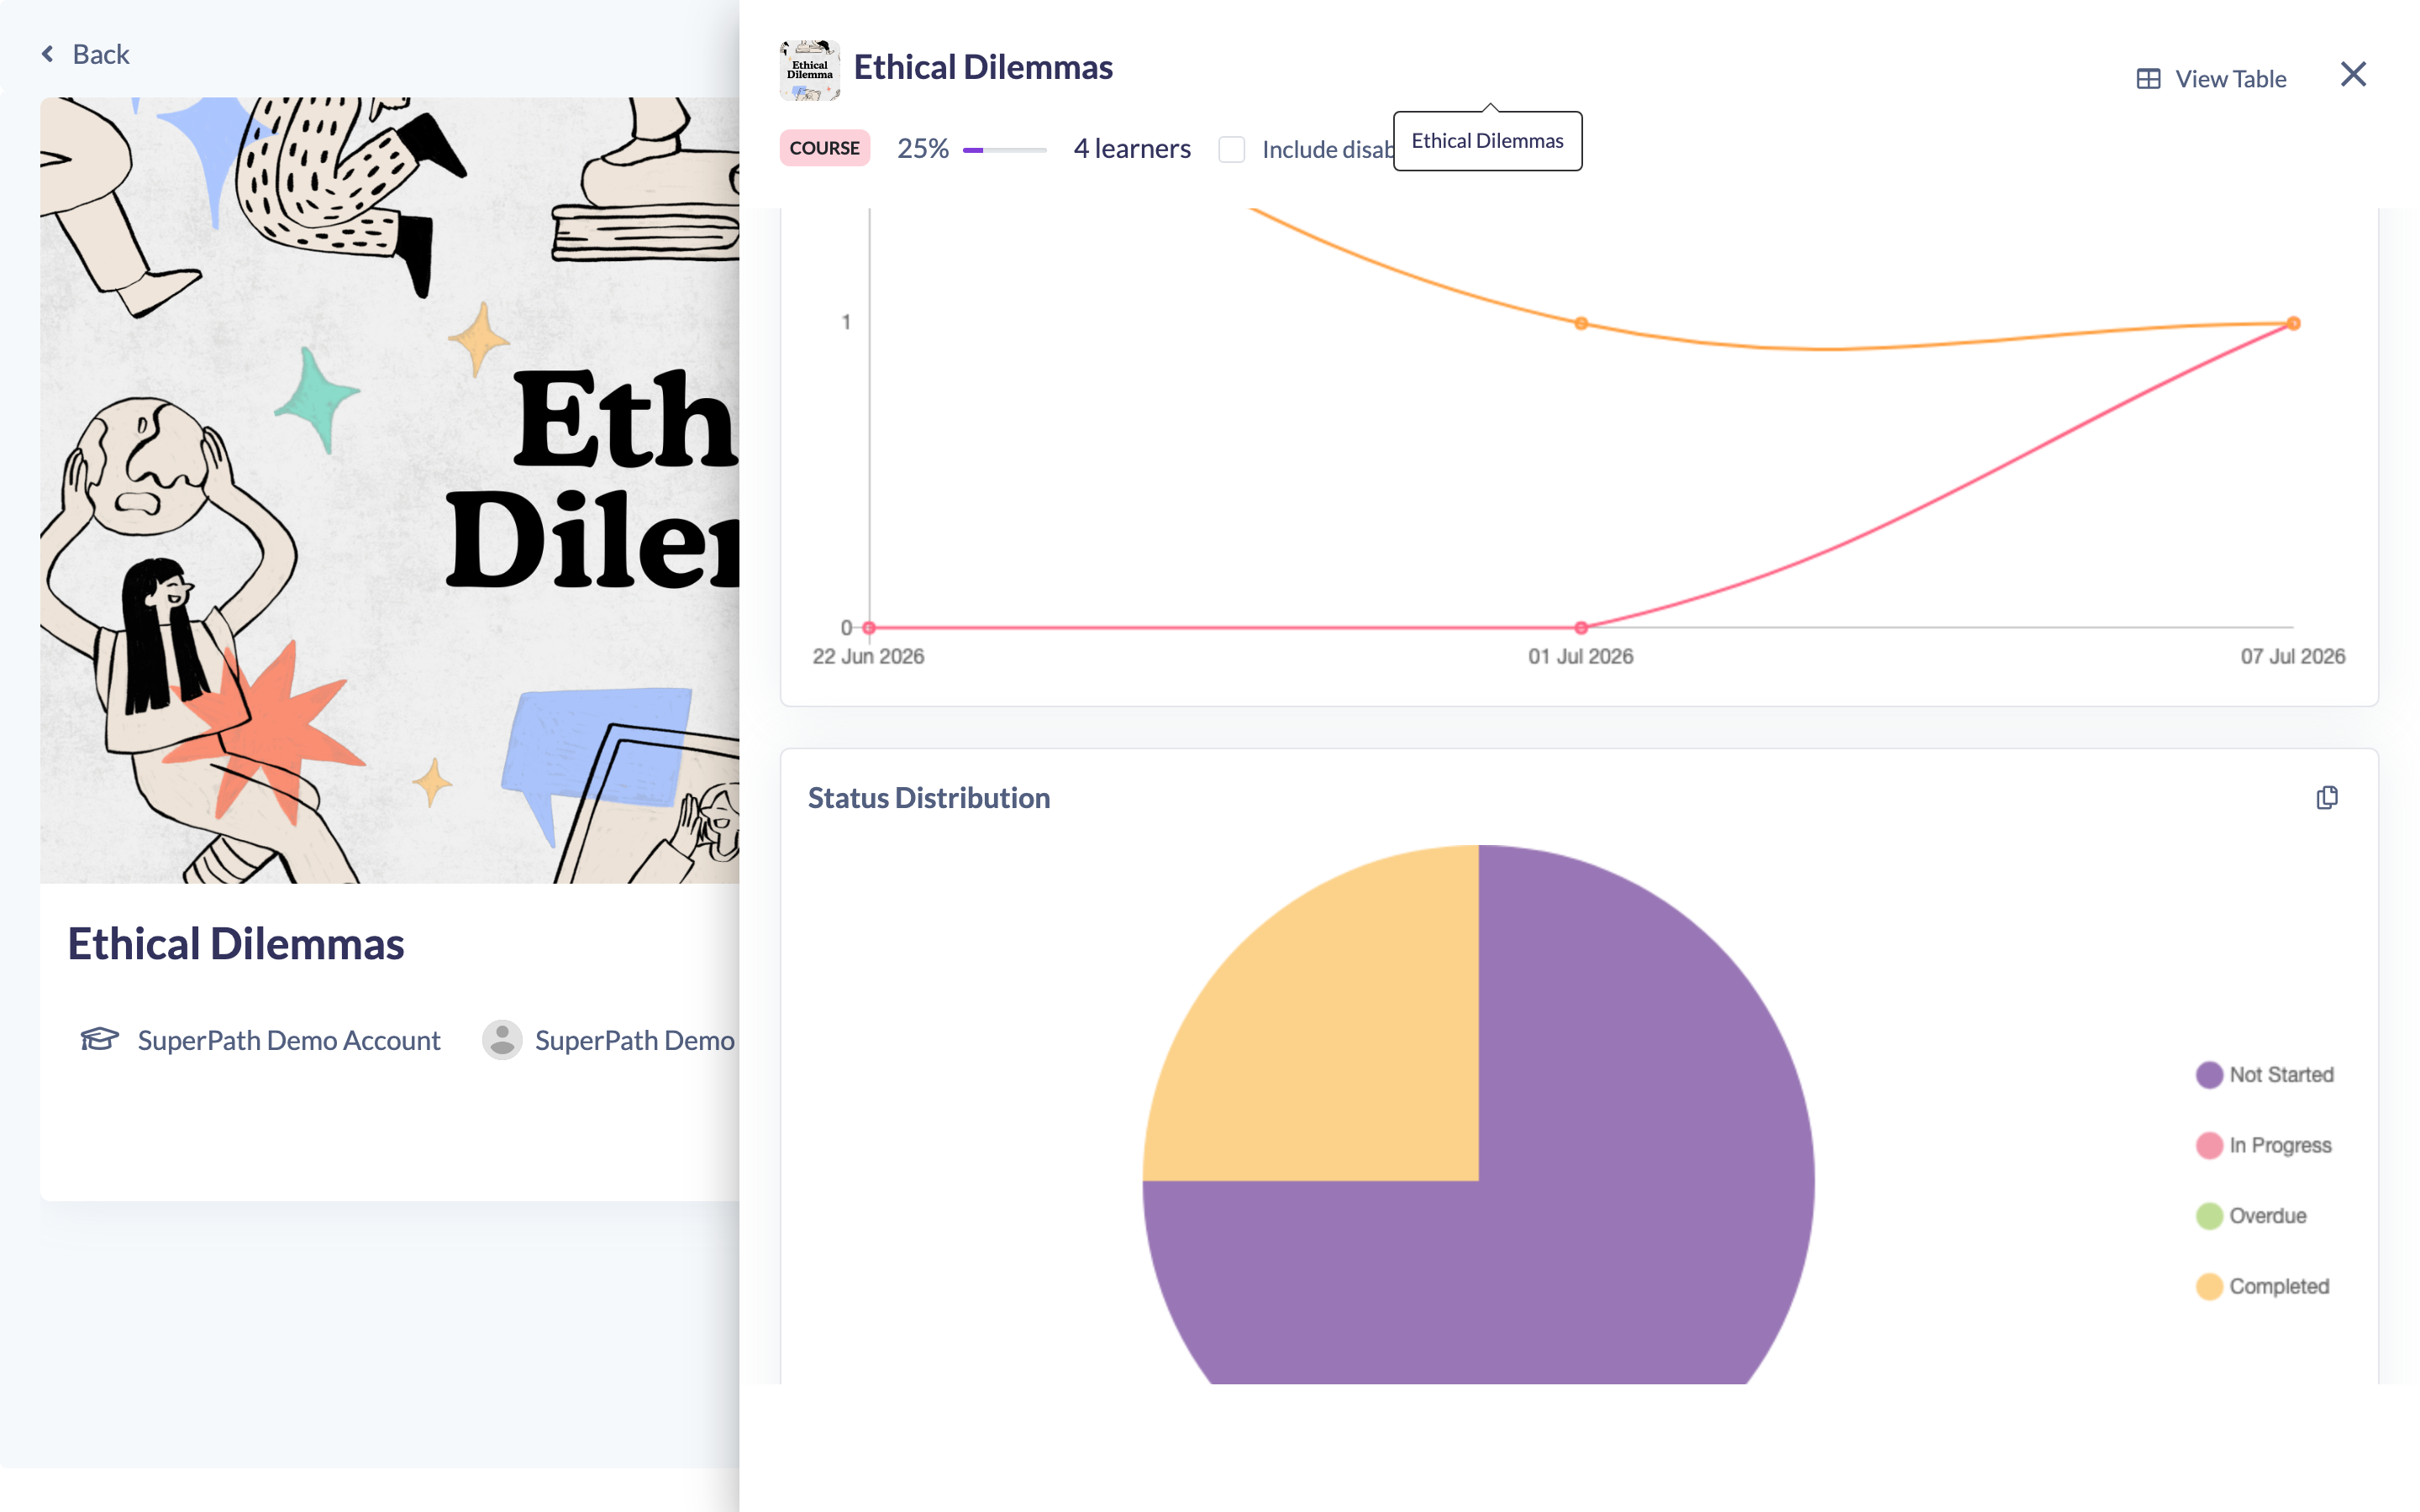
Use the icon near the top right of the panel to switch between the two views:
- Table view (the default) — the learner-by-learner list described above.
- Analytics view — click the View analytics icon (line-chart icon) to see summary cards (in progress, overdue, completed and average completion time), a status breakdown pie chart, and an assigned-vs-completed line chart over time. Click View table to switch back.
Exporting the learner report
Click the Export icon (the cloud-download icon at the top right of the panel) to download the learner list as a CSV. The file includes each learner's name, email, status, assignment and completion dates, due date, percentage complete and approval details.
If any Custom Fields have Include in reports turned on, the file also includes a column for each one. This applies to quick reports opened from Library content, Pathways, Events and Forms, but not from a Roadmap or from inside the Reports area. The columns follow each field's access level, so you only get the fields your role is allowed to see (see Managing Custom Fields).
Actions you can take from a quick report
Each learner row has an actions column, and you can select several learners at once for bulk actions. Depending on your role and the item type, you can:
- Change a due date — see How to Change a Due Date From a Quick Report.
- Mark an assignment complete — see How to Mark an Assignment Complete From a Quick Report.
- Send a notification to a learner or a selection of learners — see How to Send a Notification to Learners From a Report and How to Send a Bulk Notification to Selected Learners.
- Delete an assignment for a learner.
Things to keep in mind
- The quick report is scoped to the single item you opened it from — it is not an organisation-wide report. For broader analysis, use the full Reports section.
- Which row actions appear depends on your role and on the item's type and status. For example, marking complete is limited to Owners and Admins, and completed items can't have their due date changed.
- Recently assigned learners can take up to about a minute to appear, as the underlying index catches up; the list refreshes automatically while that's happening.
FAQs
Where does the quick report open from?
From the View learners icon on a Library content item, Pathway, Event, Form or Roadmap (and, for content, from the content item's detail page).
Is this the same as the full Reports section?
No. The quick report gives you fast, item-level data and in-line actions. The full Reports section is still best for organisation-wide or multi-item analysis.
Can I include disabled users?
Yes — tick Include disabled users at the top of the panel to add them to the list, counts and analytics.
Who can do this
The quick report is available from the Library, Pathways, Events, Forms & Quizzes, Roadmaps and Reports areas, so it can be opened by the roles that can reach those areas — typically Owners, Admins, Managers, Content Managers and People Managers (Managers and People Managers see the learners within their scope). Employees and Restricted users do not have these management areas. The actions you can take inside the panel depend on your role and are covered in the related articles.
Updated on: 29/09/2026
Thank you!