
How to View Discussion Analytics
How to View Discussion Analytics
In this article:
- Overview
- How to open the Discussions report
- What the report shows
- Changing the date range
- Things to keep in mind
- FAQs
- Who can do this
Overview
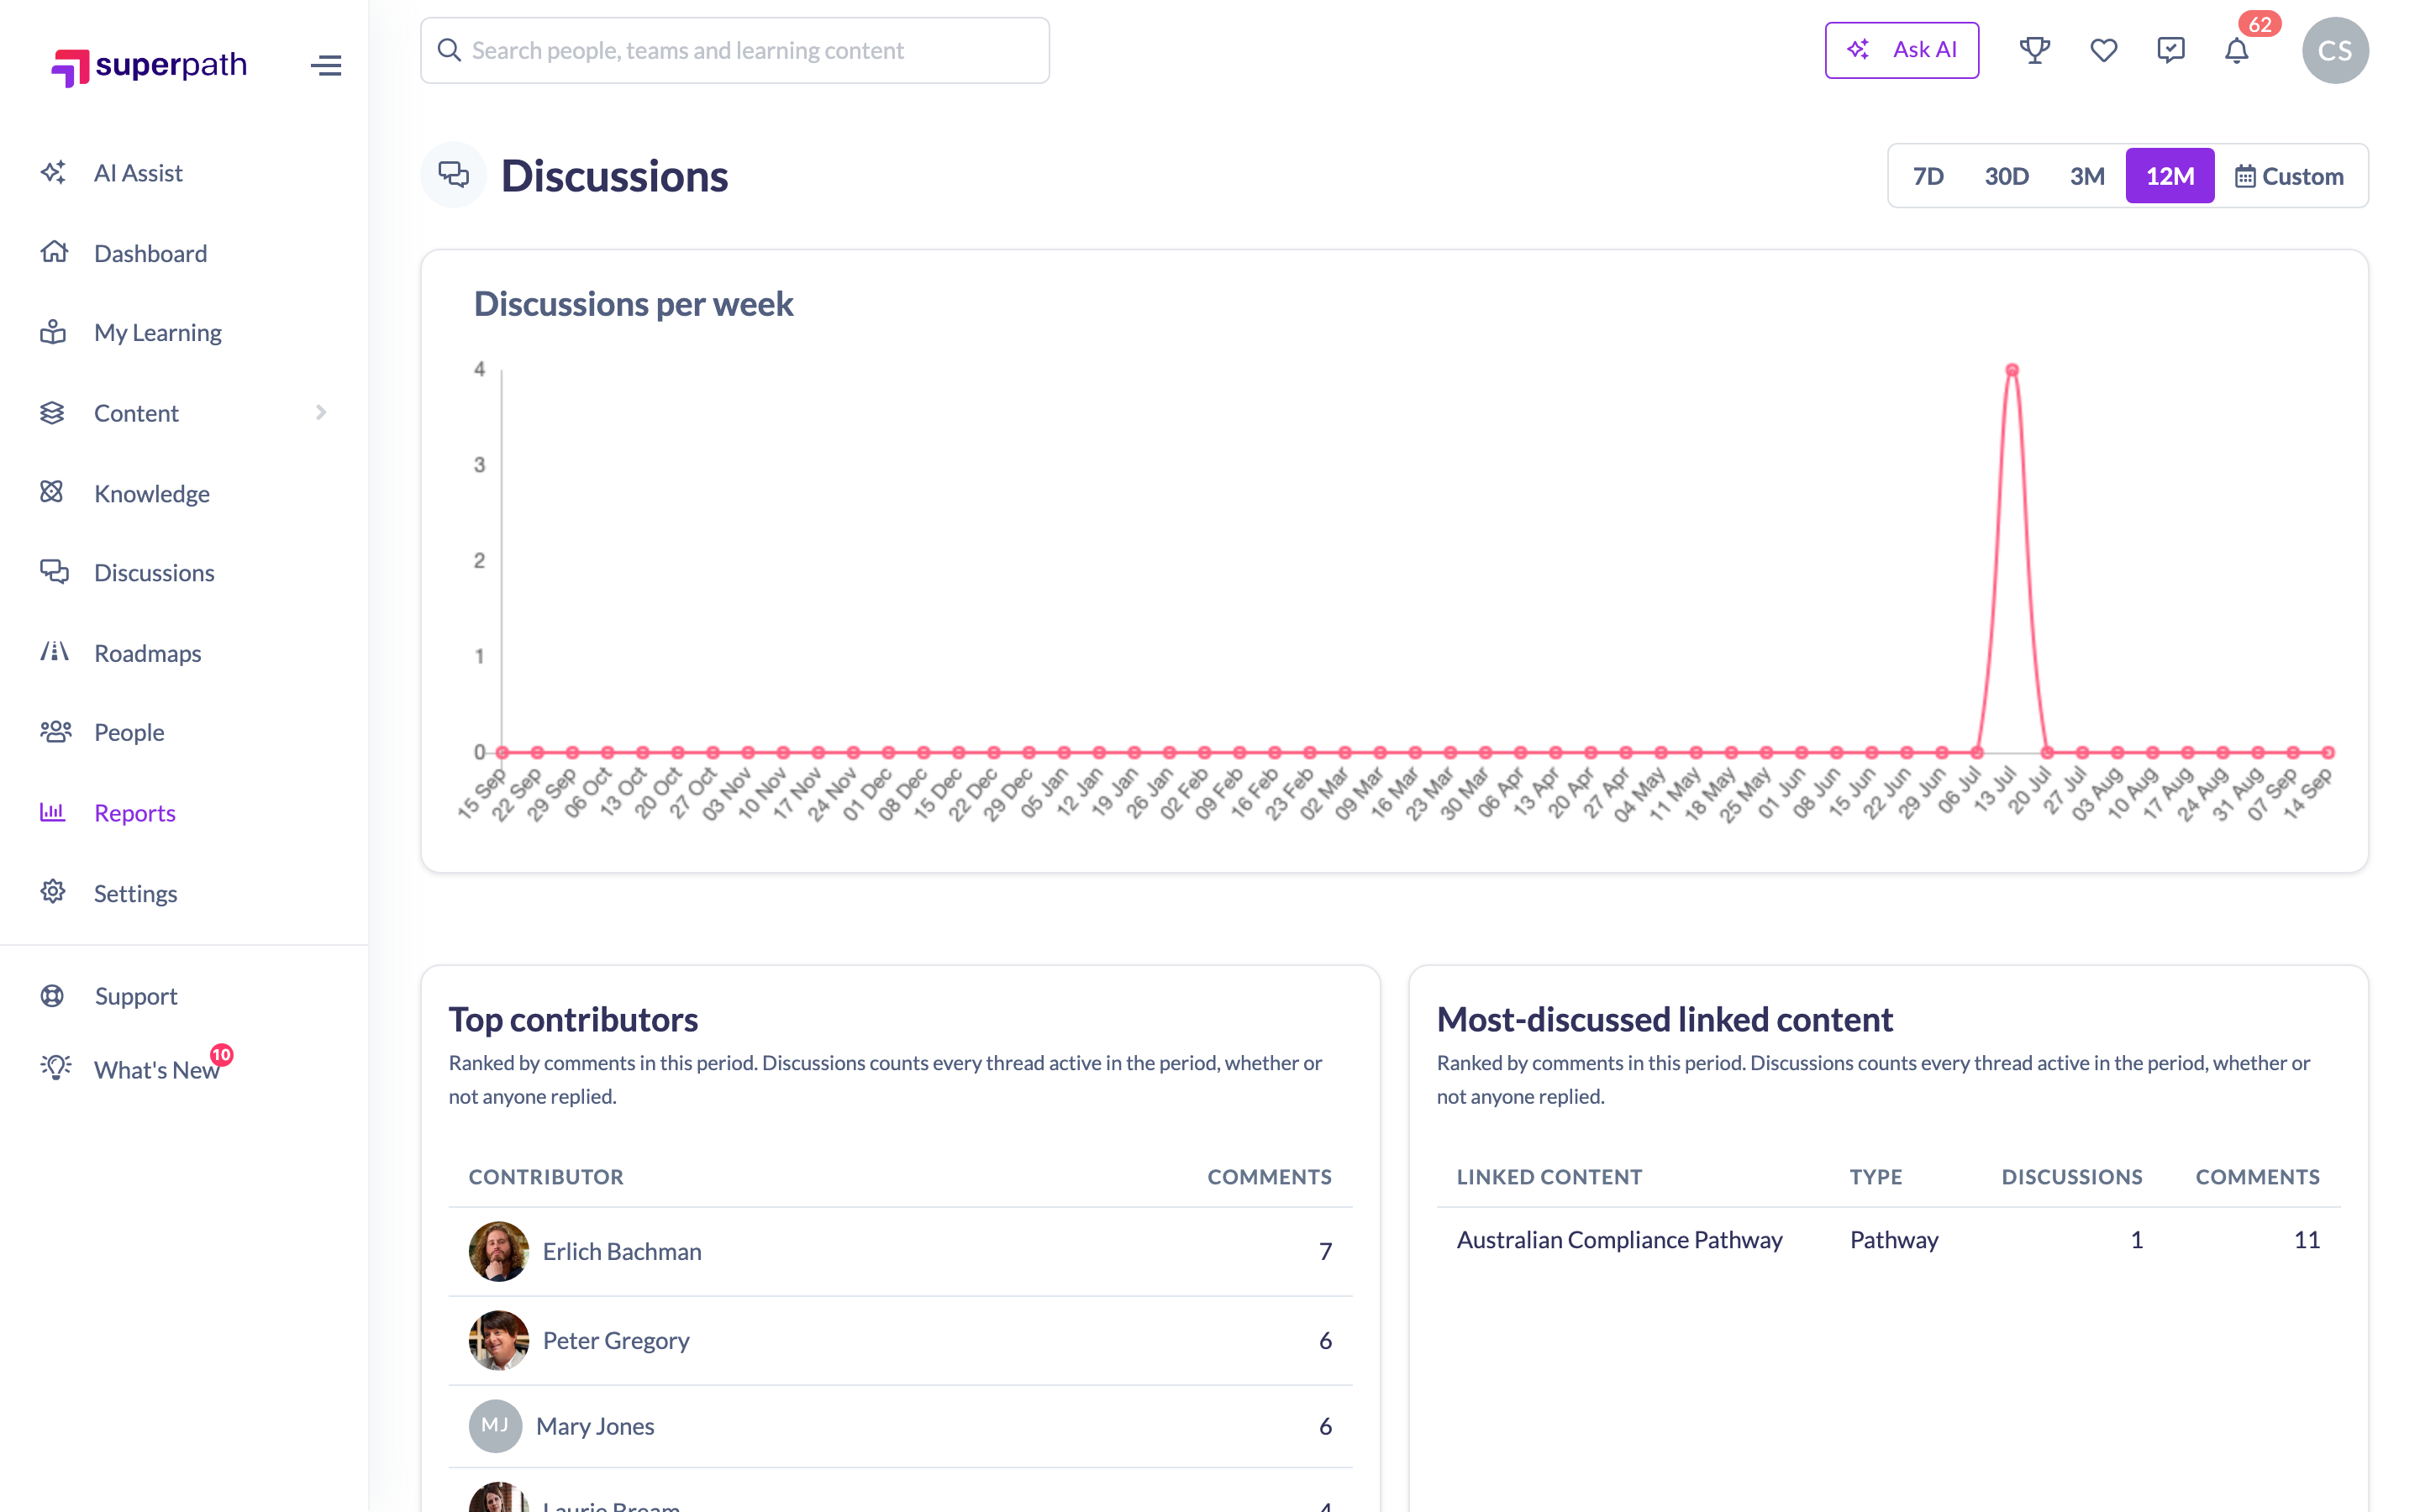
If your platform has Discussions enabled, the Discussions report shows how active your community is: a trend of discussion activity over time, your most active contributors, and the content people are discussing most. It's read-only, for seeing engagement at a glance rather than exporting data.
This used to be a section at the bottom of the old Company Analytics page. It now has a page of its own, because every panel on it answers to its own date range and it deserved controls that visibly apply to it.
How to open the Discussions report
- From the left-hand menu, open Reports.
- Click the Discussions tile.
The tile only appears when Discussions is enabled for your platform, and going to the page directly redirects you if it isn't.
What the report shows
The page has three panels, and all three follow the date range you choose:
- Discussions per week is a line chart of discussion activity across your selected period, grouped by week.
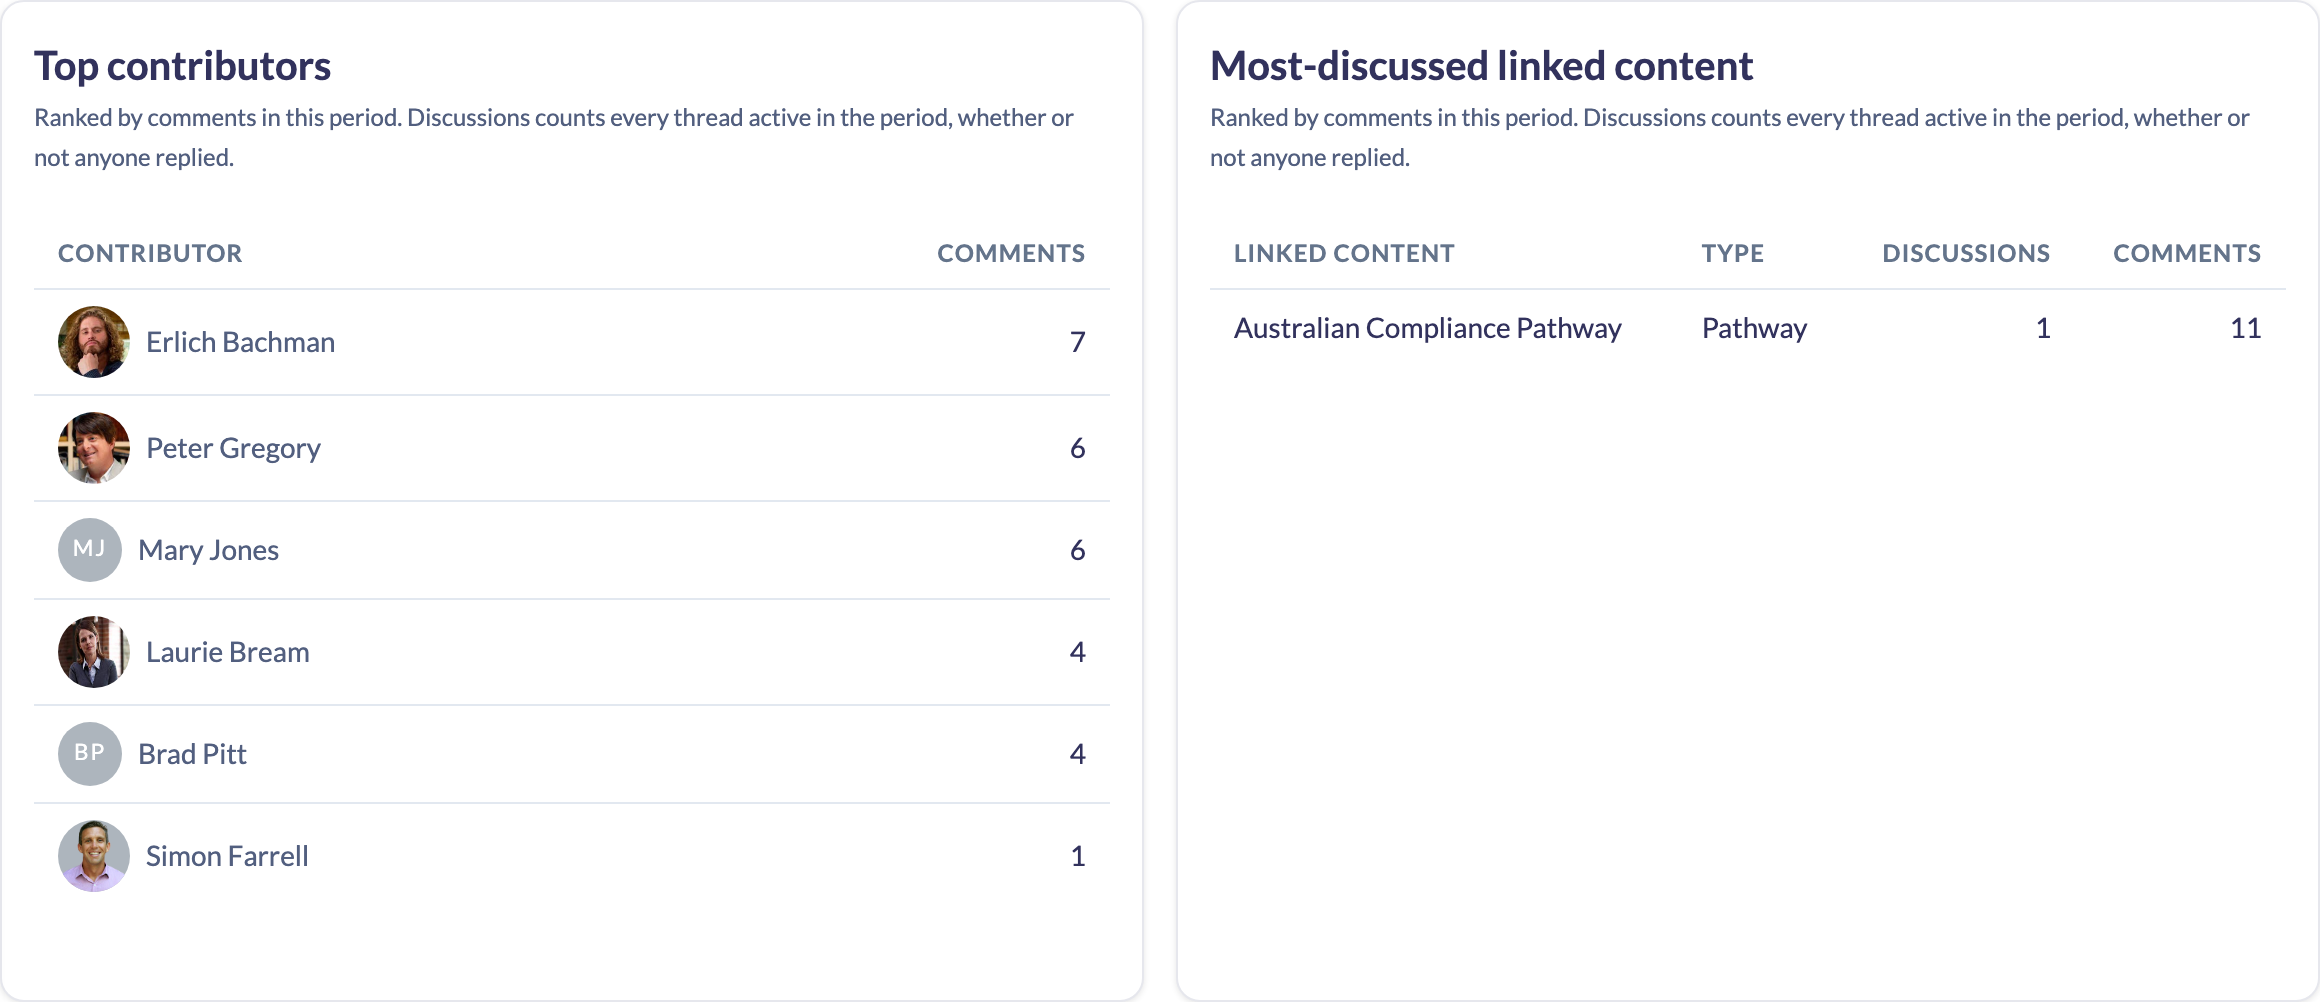
- Top contributors ranks the people posting the most comments in the period, with a Comments count each. The note under the heading reads Ranked by comment activity in this period.
- Most-discussed linked content ranks the Content, Pathways, Events and Knowledge items attracting the most discussion in the period, showing both a Discussions and a Comments count. Discussions counts every thread on that item that was active in the period, meaning it was either started in the period or commented on during it, so an item whose threads nobody has replied to yet still appears with a comment count of zero. Comments counts only the comments posted inside the period, and the ranking is by that figure, with the thread count breaking ties.
Note: Both leaderboards used to be all-time and ignored the date range. They are now scoped to the period, so the columns mean something different from before: comment activity within the window, not totals since the beginning. A long-running thread that was created last year but is being actively commented on this month now correctly appears in the current period.
Changing the date range
Use the control at the top of the page to switch period: 7D, 30D, 3M, 12M or Custom. The page opens on 12M. It's the same control as the Engagement Dashboard, so the two feel consistent, though this page starts on a wider period on purpose: discussion activity is far less frequent than learning activity, so a single month often holds nothing even on a busy platform.
If there's no discussion activity in the period, each panel names the dates it searched, for example "No discussion activity between 15 Sep 2025 and 15 Sep 2026. Try a wider date range." That wording is deliberate: an empty panel almost always means the period is too narrow rather than that you have no discussions.
A panel that couldn't load says so separately, reading "This panel could not be loaded" with a Try again button. So a blank panel and a broken one are never the same thing on screen.
Things to keep in mind
- The report only appears when Discussions is enabled for your platform.
- All three panels follow the date range. Change the range and every panel reloads, including both leaderboards.
- The report is platform-wide. There's no Team filter on it, so the figures always cover your whole organisation.
- The report is read-only, so there's nothing to export here.
FAQs
Why can't I see the Discussions report?
The tile only appears when Discussions is enabled for your platform, and only for Owners and Admins. If Discussions is switched off, the tile is hidden and the page itself redirects.
Do the leaderboards respect the date range?
Yes. All three panels do. This changed when the report moved to its own page: previously the two leaderboards were all-time and only the trend chart followed the range.
What counts as "linked content"?
Discussions can be attached to Content, Pathways, Events and Knowledge items. The Most-discussed linked content panel ranks those items by how much discussion they've generated.
An item shows 4 discussions but 0 comments. Is that right?
Yes. The Discussions column counts threads that were active in the period, and starting a thread counts as activity on its own. Four threads that nobody has replied to yet is four discussions and no comments.
Who can do this
The Discussions tile on the Reports page, and the report itself, are available to Owners and Admins only, and only when Discussions is enabled for your platform. Managers, People Managers, Content Managers, Instructors, Employees and Restricted users have no route to it, and the page enforces this itself rather than relying on the tile being hidden.
Updated on: 16/09/2026
Thank you!