
Learning Matrix Report
Learning Matrix Report
In this article:
- Overview
- How to generate the report
- What the report shows
- Editing, exporting and saving
- Things to keep in mind
- FAQs
- Who can do this
Overview
The Learning Matrix Report gives you a grid of people against specific Learnings, showing where each person stands on each item. You pick the Learnings you want to track — Content, Events or Pathways — and the people or Teams to check, and SuperPath builds a matrix with a person on each row and a Learning in each column. It's the quickest way to compare completion across a group for a defined set of Learnings.
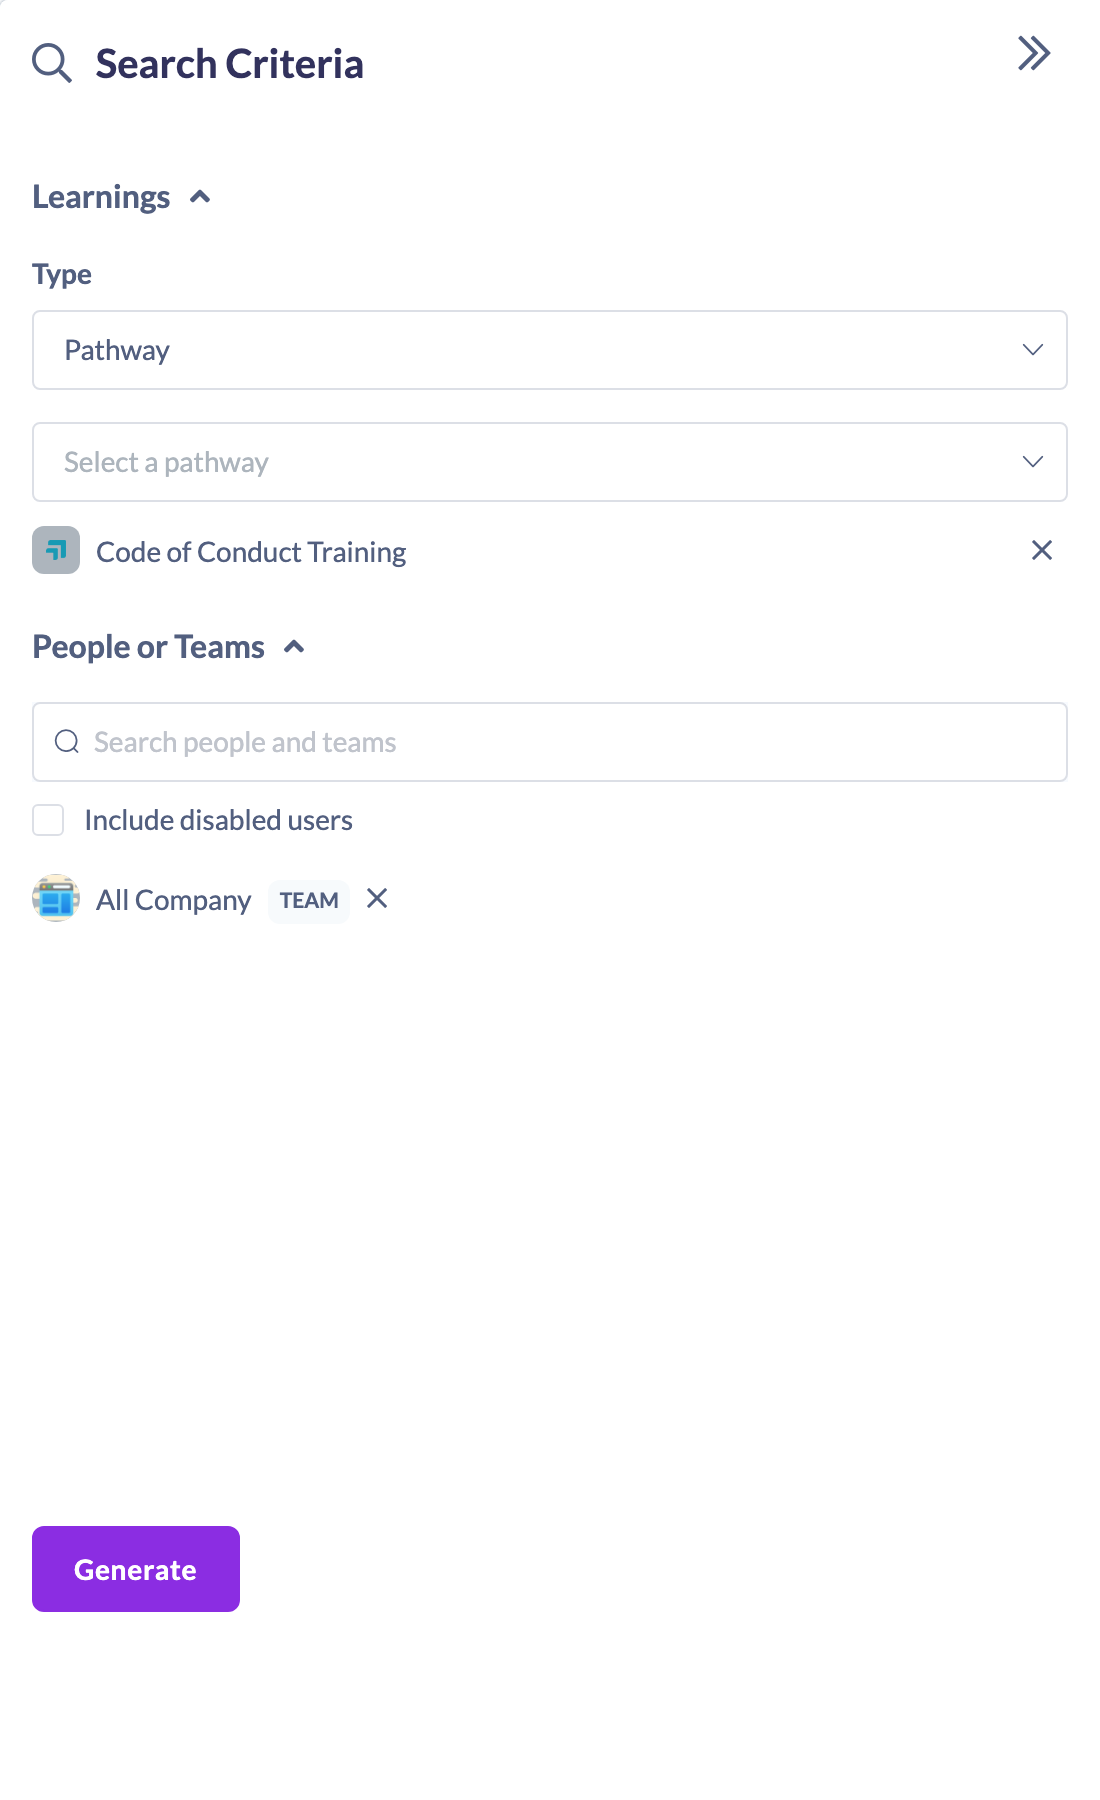
How to generate the report
- In the left-hand menu, open Reports.
- On the Reports page, click the Learning Matrix tile.
- In the Search Criteria panel, under Learnings, choose a Type — Content, Event or Pathway — then select the item to add it to the report. Repeat to add as many Learnings as you need.
- Under People or Teams, search for and select the people or Teams you want to report on (for example, your All Company Team for everyone).
- Click Generate.
What the report shows
The matrix has one row per person, with a Name and Position column followed by one column for each Learning you added. Each cell shows that person's status for that Learning:
- A green tick — Completed.
- Orange sync arrows — In Progress.
- A red cross — Not Started.
- A circle with a line through it — Not Assigned (the Learning isn't assigned to that person).
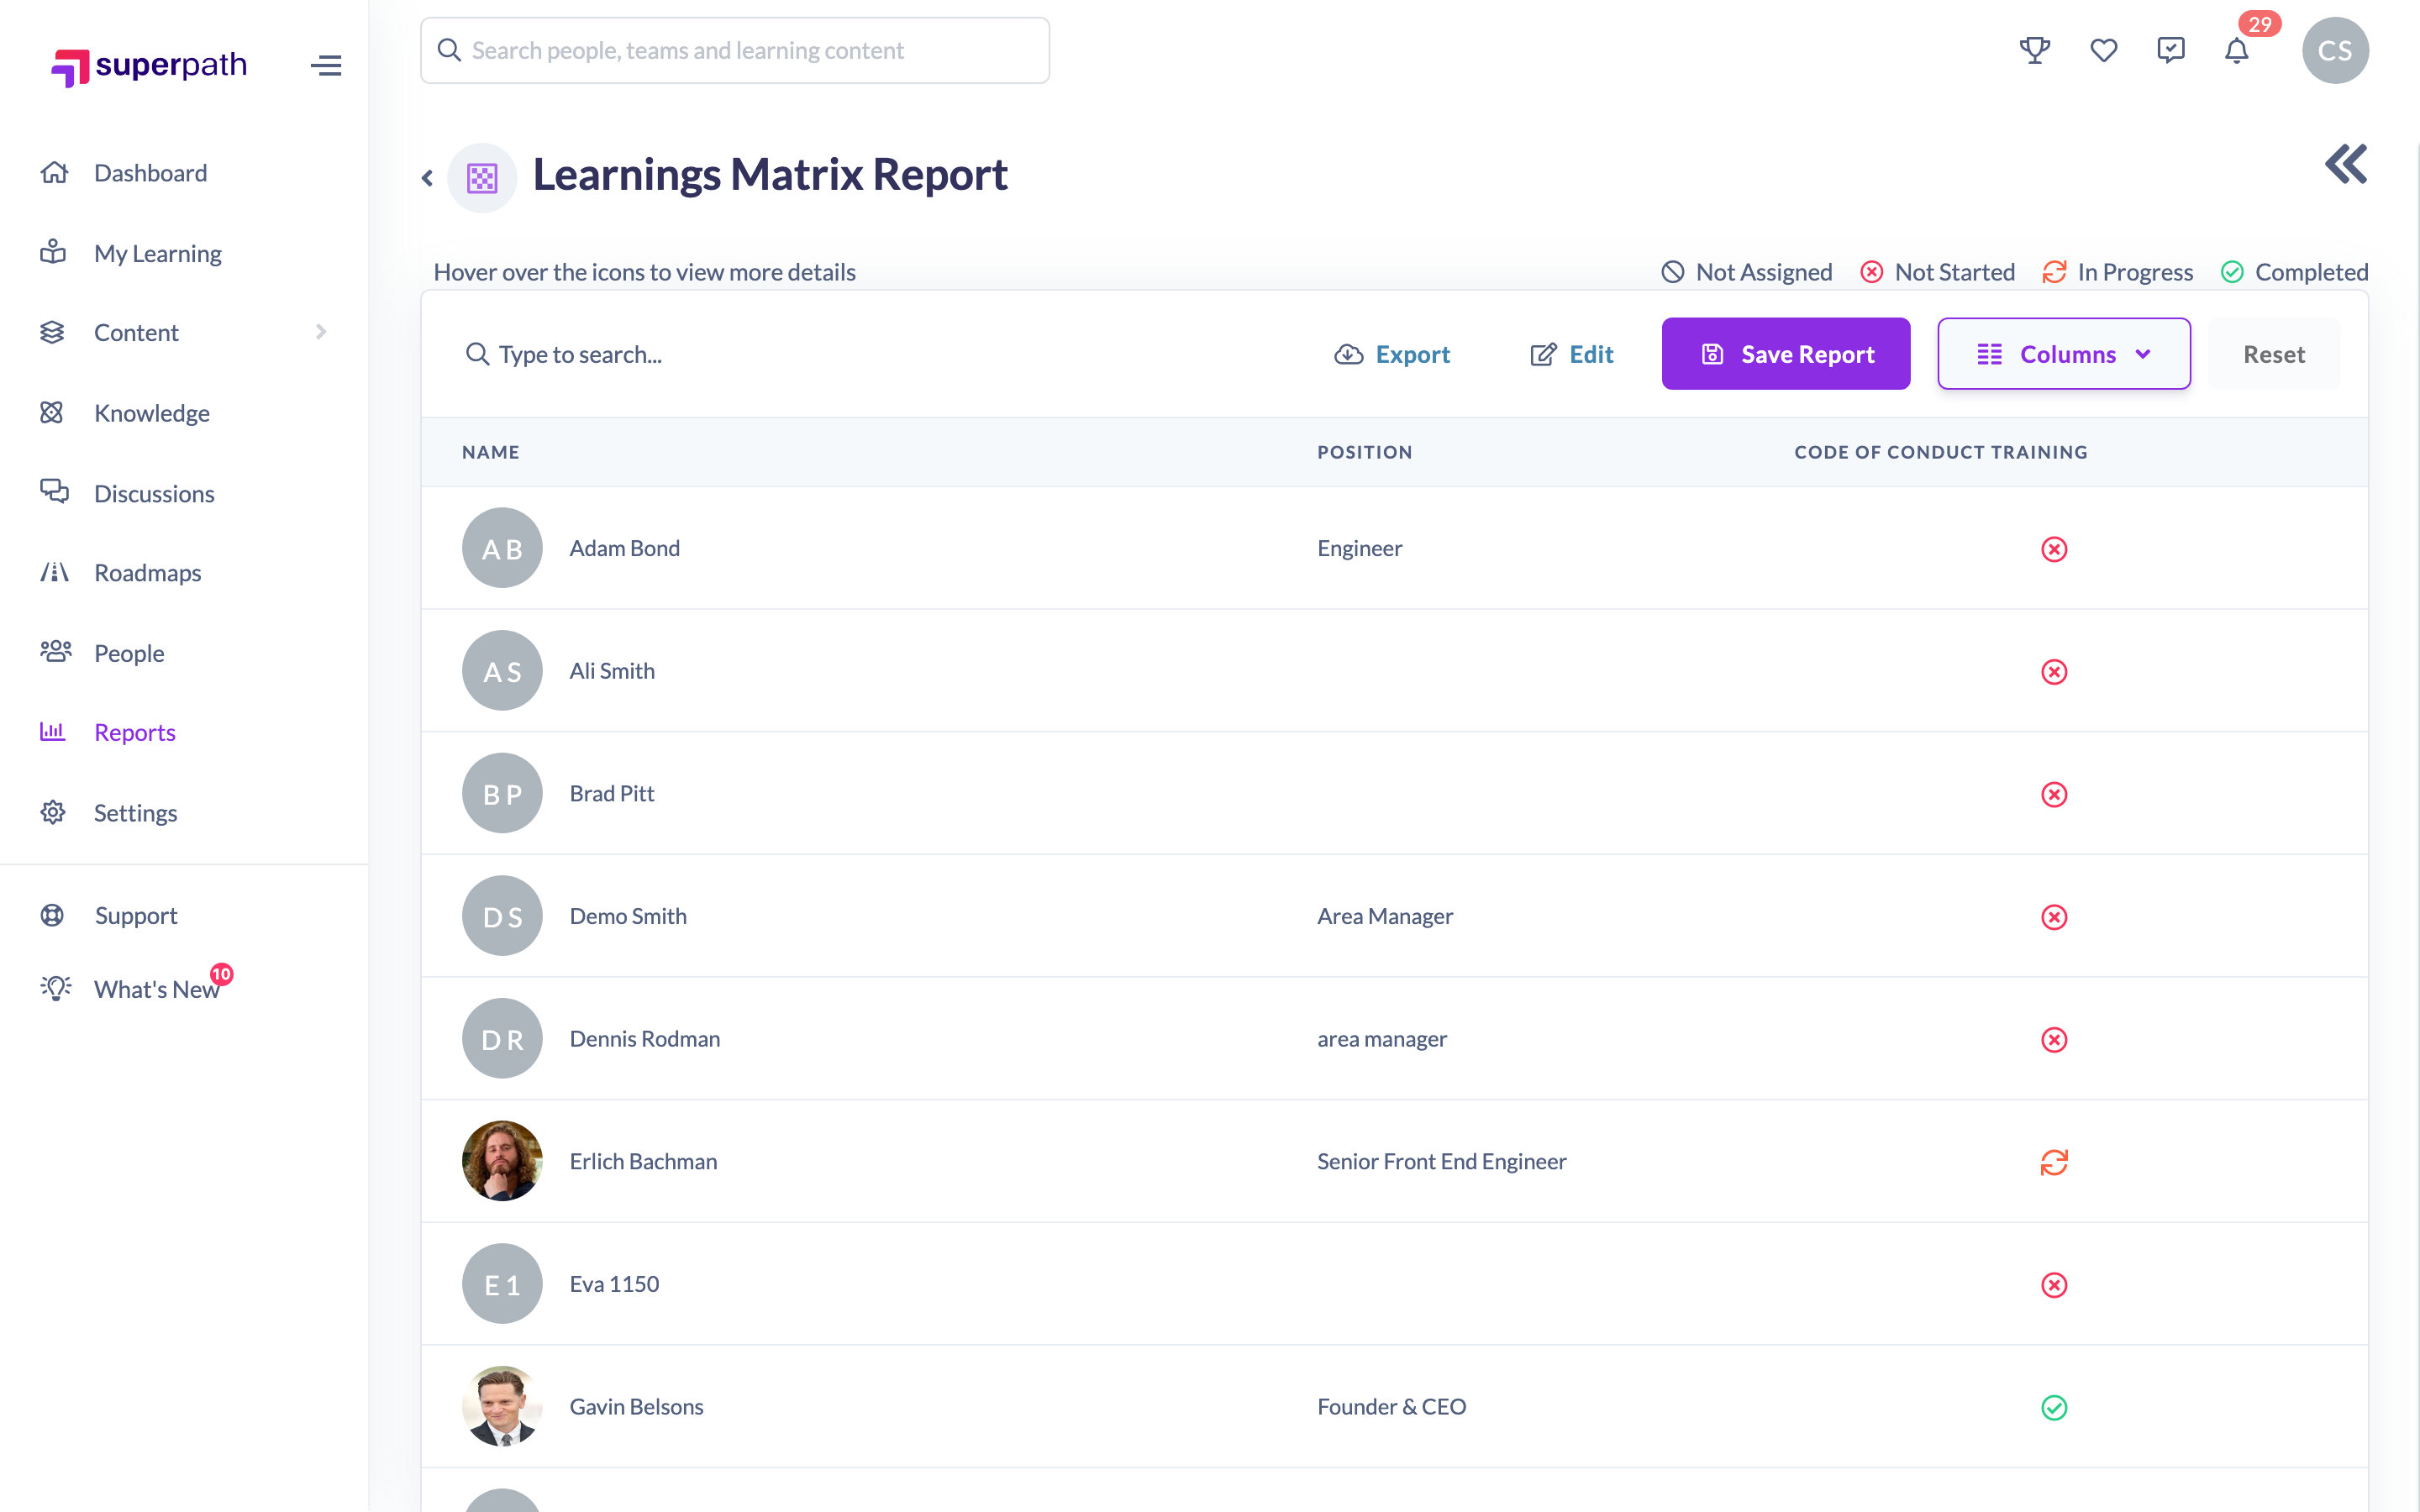
Hover over any status icon to see more detail about that person's progress on that Learning.
If any Custom Fields have Include in reports turned on, each one appears as an extra column after Position and before the Learning columns.
Editing, exporting and saving
Once the report is generated you can:
- Edit: click Edit to reopen the Search Criteria panel, add or remove Learnings, people or Teams, and click Generate again to refresh the matrix.
- Export: click Export to choose which columns to include and download the matrix as a CSV (see How to Export a Report to CSV and How to Choose Which Columns to Export). The export can include Name, Position, User External ID, User Status, Email, State and Country, plus any Custom Fields included in reports and a column for each Learning.
- Save: click Save Report, give it a name you'll recognise in the Saved Reports tab, and click Save so you can reopen it later (see How to Save a Report).
Things to keep in mind
- You can mix Content, Events and Pathways in the same matrix.
- Not Assigned means the Learning simply isn't assigned to that person — it's not the same as Not Started, where the Learning is assigned but not yet begun.
- Managers and People Managers can only report on their own direct reports and Teams; Owners and Admins can select anyone.
- Custom Field columns follow each field's access level. Owners and Admins see every field included in reports, while Managers and People Managers only see fields set to Everyone or Managers & admins (see Managing Custom Fields).
FAQs
What's the difference between Not Assigned and Not Started?
Not Assigned means the person doesn't have that Learning assigned at all. Not Started means it's assigned but they haven't begun it.
Can I report on Content, Events and Pathways together?
Yes — add each one under Learnings in the Search Criteria panel; they'll each appear as a column in the matrix.
How is this different from the Learning Content Report?
The Learning Content Report summarises each Learning across everyone enrolled. The Learning Matrix compares a chosen set of Learnings against a chosen set of people, cell by cell.
Who can do this
The Learning Matrix Report is reached from the Reports page, which is available to Owners, Admins, Managers and People Managers. Managers and People Managers can only report on their own direct reports and Teams, while Owners and Admins can select anyone. Content Managers, Instructors, Employees and Restricted users don't have access to the Reports area.
Updated on: 29/09/2026
Thank you!